stem([1,2,3])
一、初始设置
%% 初始设置
% 清空工作空间,关闭无关页面
clc,clear,close all;
% 绘图变量
font_size = 12; %全局基础字体大小
axis_size = 10; %坐标轴刻度标签字体大小
line_width = 2; %绘图线条宽度
legend_size = 10.5; %图例字体大小
marker_size = 12; %数据点标记尺寸
figure_width = 14; %图形整体宽度(单位:英寸)
figure_height = 8; %图形整体高度(单位:英寸)
BiaValue = 0; %偏置值/基准值(用于数据校准或零值参考)
二、波形、图
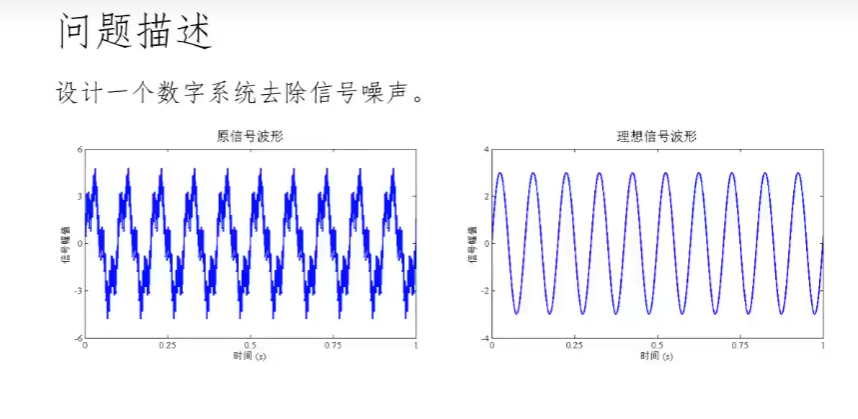
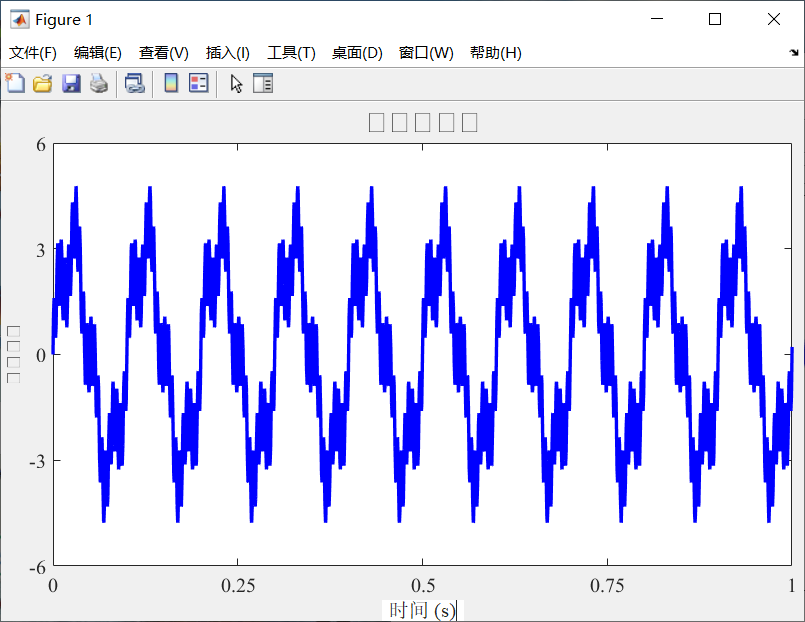
原始信号波形
%% //绘制原信号波形
t = 0:0.0001:10;
y = 3*sin(2*pi*10*t) + sin(2*pi*40*t) + sin(2*pi*200*t);figure
%% 图形窗口参数设置
% 单位转换:英寸→厘米(1英寸=2.54厘米)
% 窗口位置:[左下角x坐标, y坐标, 宽度, 高度]
set(gcf,'Unit','centimeters','Position',[3 3 3+figure_width 3+figure_height]); % 边距3cm+内容尺寸%% 坐标轴精细调整
% LooseInset: 控制坐标轴与图形边界的间距
% TightInset: 系统自动计算的最小边距
% BiaValue: 用于X轴方向的额外偏移补偿(如避免标签截断)
set(gca,'LooseInset',get(gca,'TightInset')+[BiaValue,0,0,0],'FontName','Times New Roman','FontSize',font_size);
plot(t, y, 'b-', 'LineWidth', line_width) % 蓝色实线 线宽控制
set(gca,'FontSize',font_size,'FontName','Times New Roman') % 字体统一配置(确保中英文字体兼容)
xlim([0 1]); % 显示1秒时长
ylim([-6 6]); % 幅值范围覆盖所有分量(3*1 + 1 + 1 = 5 +余量)
set(gca, 'XTick', 0:0.25:1); % 每250ms一个主刻度
set(gca, 'YTick', -6:3:6); % 幅值刻度步长3
xlabel('时间 (s)', 'FontSize', font_size, 'FontName', 'Times New Roman');
ylabel('信号幅值', 'FontSize', font_size, 'FontName', 'Times New Roman');
title('原信号波形', 'FontSize', font_size*1.5, 'FontName', 'Times New Roman');
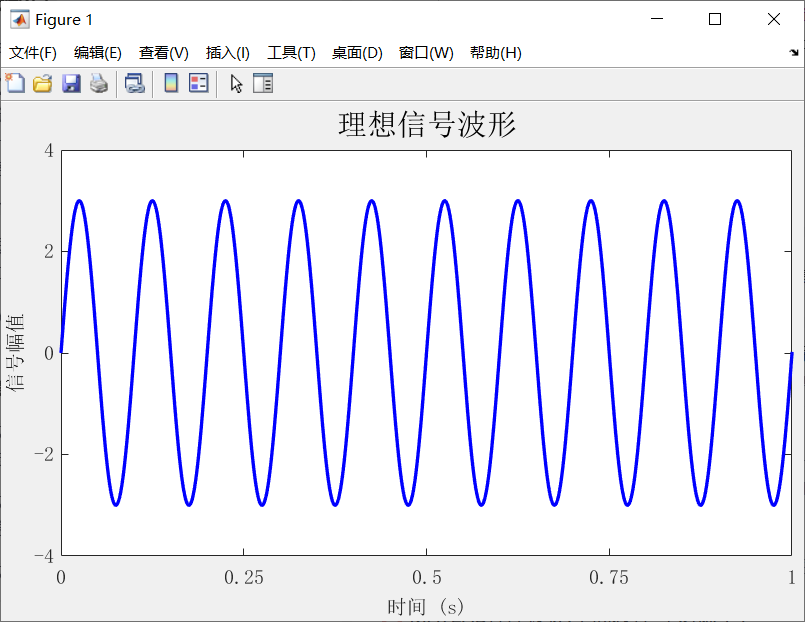
理想信号波形
%% //绘制理想信号波形
t = 0:0.0001:10;
y = 3*sin(2*pi*10*t);
figure
set(gcf,'Unit','centimeters','Position',[3 3 3+figure_width 3+figure_height]);
set(gca,'LooseInset',get(gca,'TightInset')+[BiaValue,0,0,0],'FontName','Times New Roman','FontSize',font_size);
plot(t, y, 'b-', 'LineWidth', line_width)
set(gca,'FontSize',font_size,'FontName','Times New Roman')
xlim([0 1])
ylim([-4 4])
set(gca,'XTick',0:0.25:1)
set(gca,'YTick',-4:2:4)
xlabel('时间 (s)', 'FontSize', font_size, 'FontName', 'Times New Roman')
ylabel('信号幅值', 'FontSize', font_size, 'FontName', 'Times New Roman')
title('理想信号波形', 'FontSize', font_size*1.5, 'FontName', 'Times New Roman')
幅频、相频图
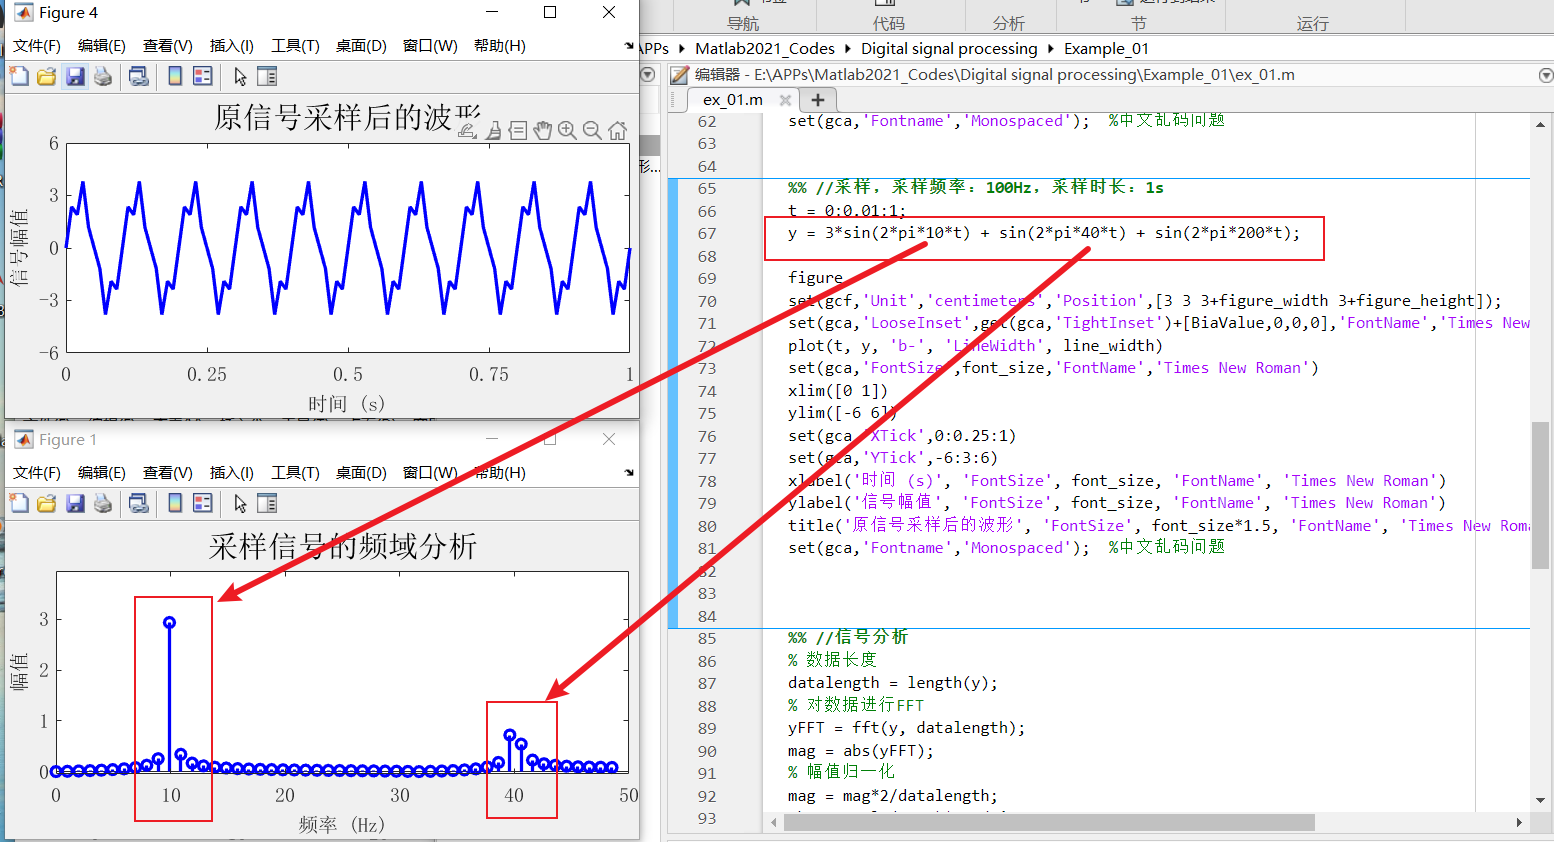
%% //采样,采样频率:100Hz,采样时长:1s
t = 0:0.01:1;
y = 3*sin(2*pi*10*t) + sin(2*pi*40*t) + sin(2*pi*200*t);
% figure
% set(gcf,'Unit','centimeters','Position',[3 3 3+figure_width 3+figure_height]);
% set(gca,'LooseInset',get(gca,'TightInset')+[BiaValue,0,0,0],'FontName','Times New Roman','FontSize',font_size);
% plot(t, y, 'b-', 'LineWidth', line_width)
% set(gca,'FontSize',font_size,'FontName','Times New Roman')
% xlim([0 1])
% ylim([-6 6])
% set(gca,'XTick',0:0.25:1)
% set(gca,'YTick',-6:3:6)
% xlabel('时间 (s)', 'FontSize', font_size, 'FontName', 'Times New Roman')
% ylabel('信号幅值', 'FontSize', font_size, 'FontName', 'Times New Roman')
% title('原信号采样后的波形', 'FontSize', font_size*1.5, 'FontName', 'Times New Roman');
% set(gca,'Fontname','Monospaced'); %中文乱码问题
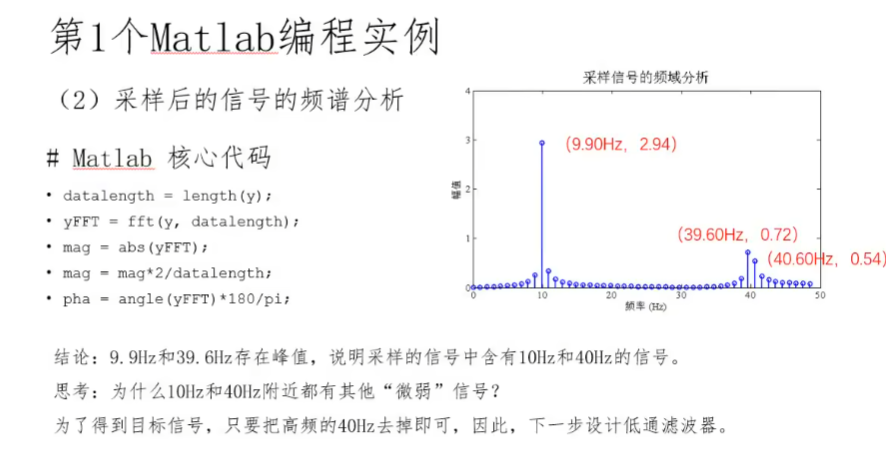
%% //信号分析
% 数据长度
datalength = length(y);
% 对数据进行FFT
yFFT = fft(y, datalength);
mag = abs(yFFT);
% 幅值归一化
mag = mag*2/datalength;
pha = angle(yFFT)*180/pi;
% 对无效相位进行置0
for i = 1:datalength
if (mag(1,i)<0.3)
pha(1,i) = 0;
end
end% 序列坐标
n = 0:datalength-1;
% 采样频率
fs = 1/0.01;
% 序列频率
f = (0:datalength-1)*fs/datalength;
figure
set(gcf,'Unit','centimeters','Position',[3 3 3+figure_width 3+figure_height]);
set(gca,'LooseInset',get(gca,'TightInset')+[BiaValue,0,0,0],'FontName','Times New Roman','FontSize',font_size);
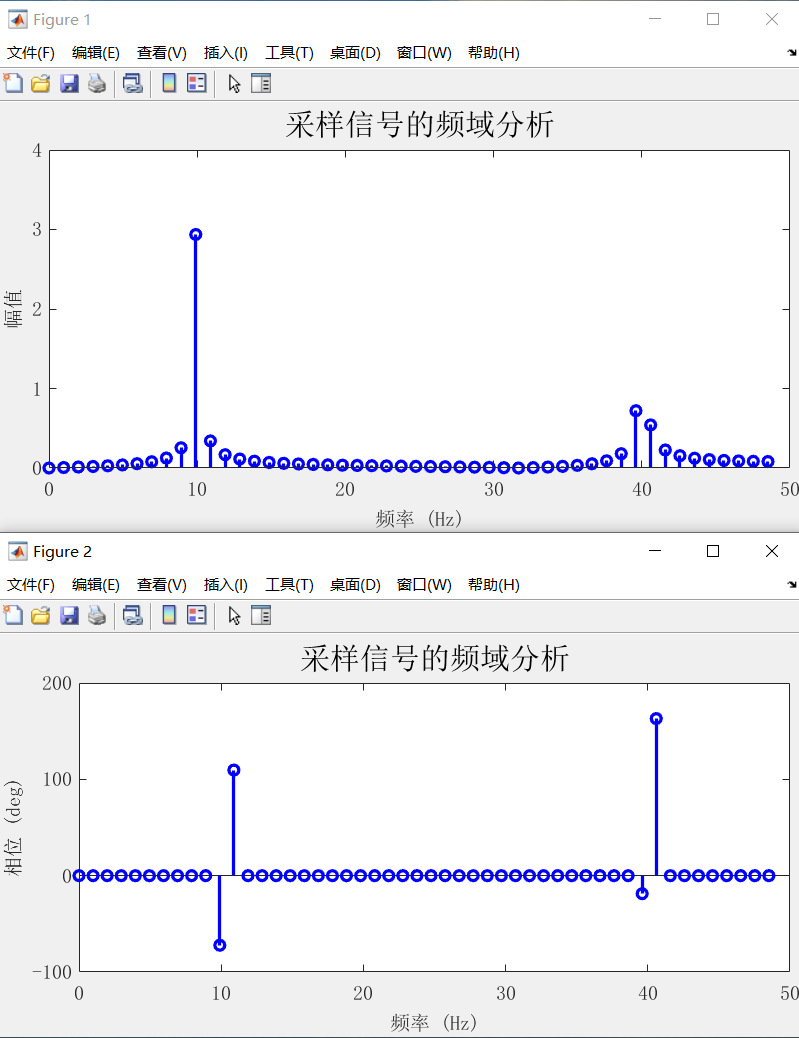
stem(f(1:datalength/2), mag(1:datalength/2), 'b-', 'LineWidth', line_width)
set(gca,'FontSize',font_size,'FontName','Times New Roman')
xlim([0 50])
ylim([0 4])
set(gca,'XTick',0:10:50)
set(gca,'YTick',0:1:4)
xlabel('频率 (Hz)', 'FontSize', font_size, 'FontName', 'Times New Roman')
ylabel('幅值', 'FontSize', font_size, 'FontName', 'Times New Roman')
title('采样信号的频域分析', 'FontSize', font_size*1.5, 'FontName', 'Times New Roman')
set(gca,'Fontname','Monospaced'); %中文乱码问题figure
set(gcf,'Unit','centimeters','Position',[3 3 3+figure_width 3+figure_height]);
set(gca,'LooseInset',get(gca,'TightInset')+[BiaValue,0,0,0],'FontName','Times New Roman','FontSize',font_size);
stem(f(1:datalength/2), pha(1:datalength/2), 'b-', 'LineWidth', line_width)
set(gca,'FontSize',font_size,'FontName','Times New Roman')
xlim([0 50])
ylim([-100 200])
set(gca,'XTick',0:10:50)
set(gca,'YTick',-100:100:200)
xlabel('频率 (Hz)', 'FontSize', font_size, 'FontName', 'Times New Roman')
ylabel('相位 (deg)', 'FontSize', font_size, 'FontName', 'Times New Roman')
title('采样信号的频域分析', 'FontSize', font_size*1.5, 'FontName', 'Times New Roman')
set(gca,'Fontname','Monospaced'); %中文乱码问题
三、低通滤波器
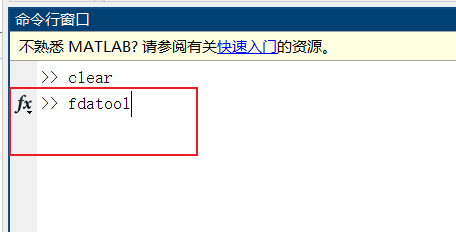
fdatool
打开工具箱

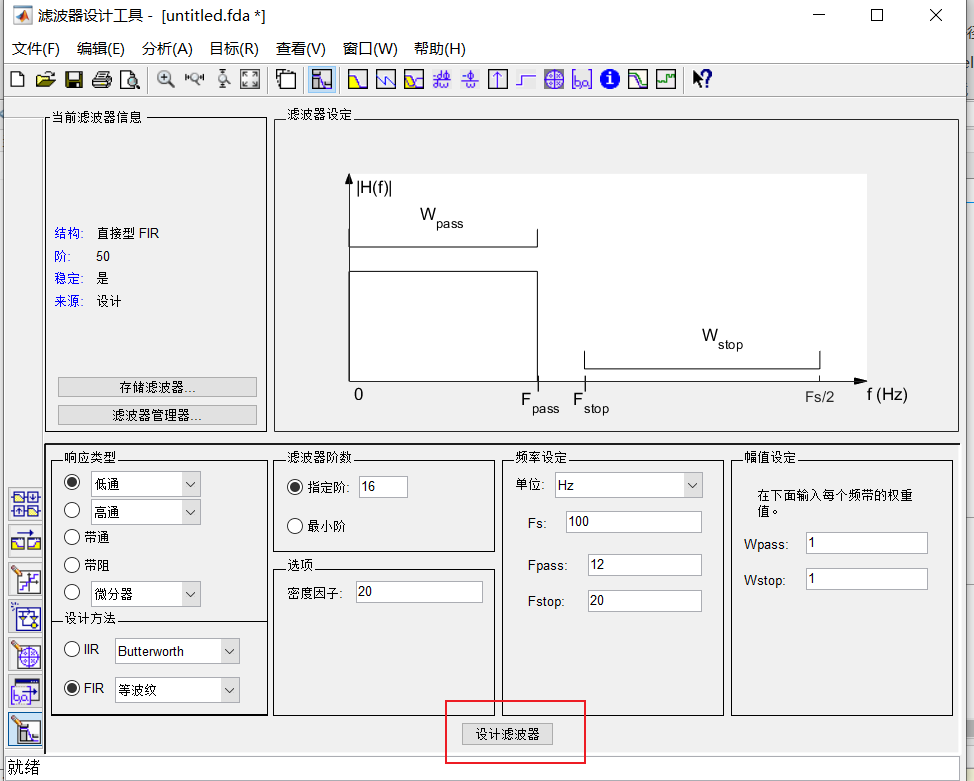
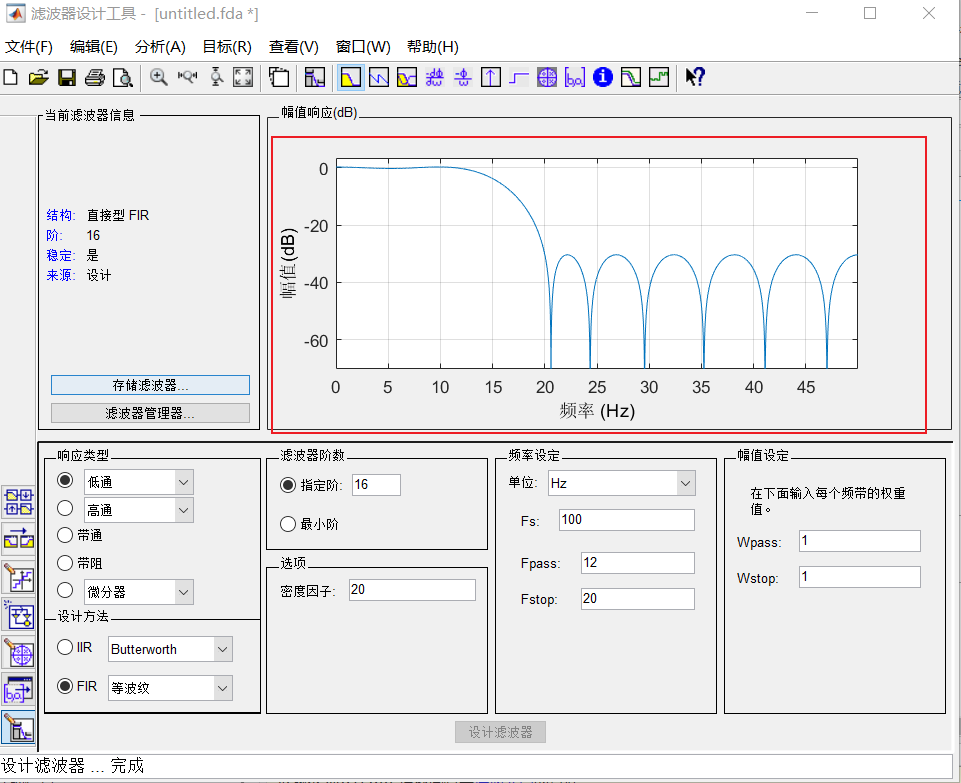
打开后,保存为Filter_E3.mat
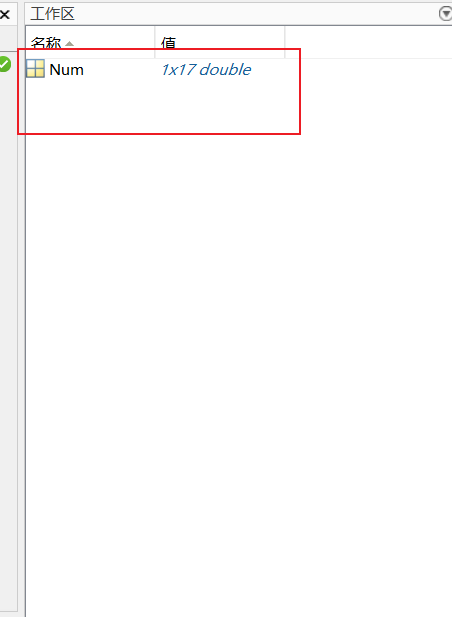
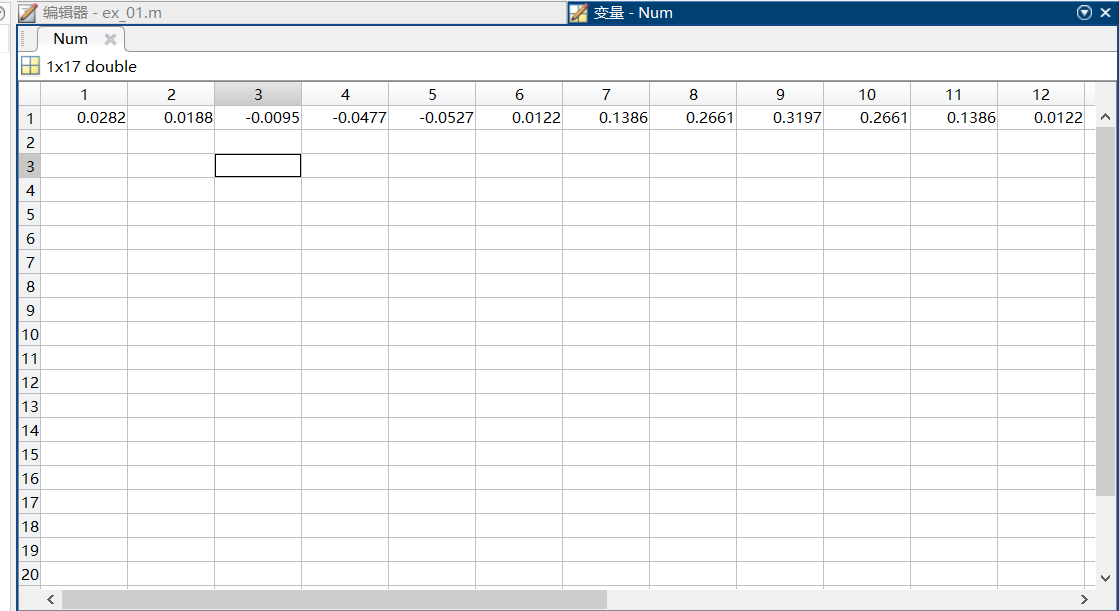
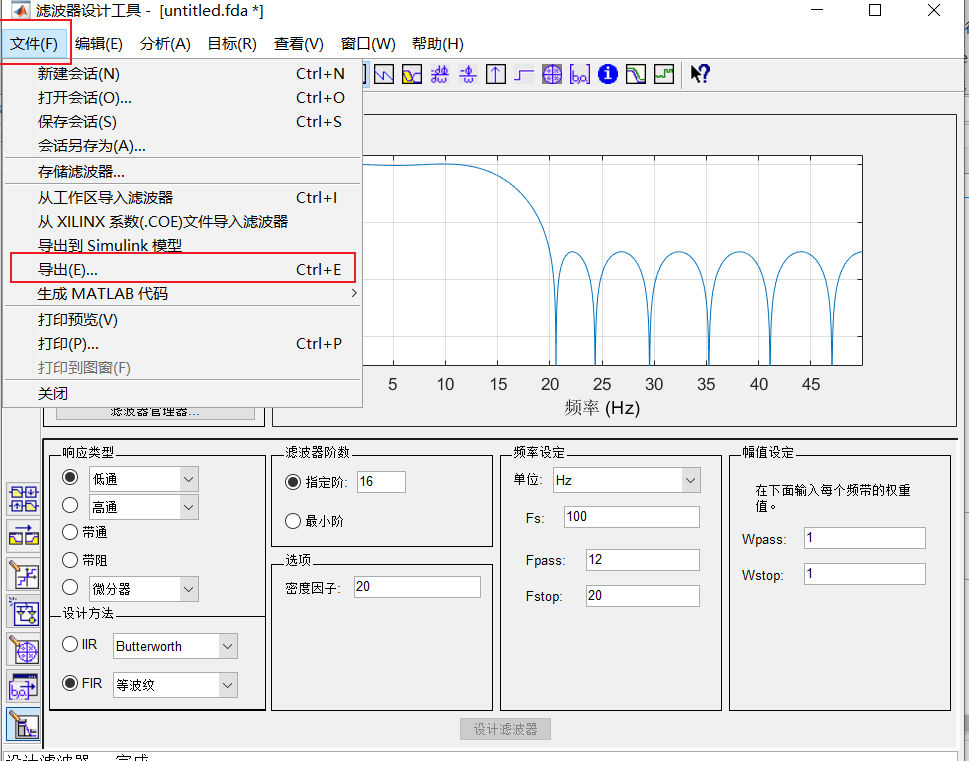
保存后,双击此处
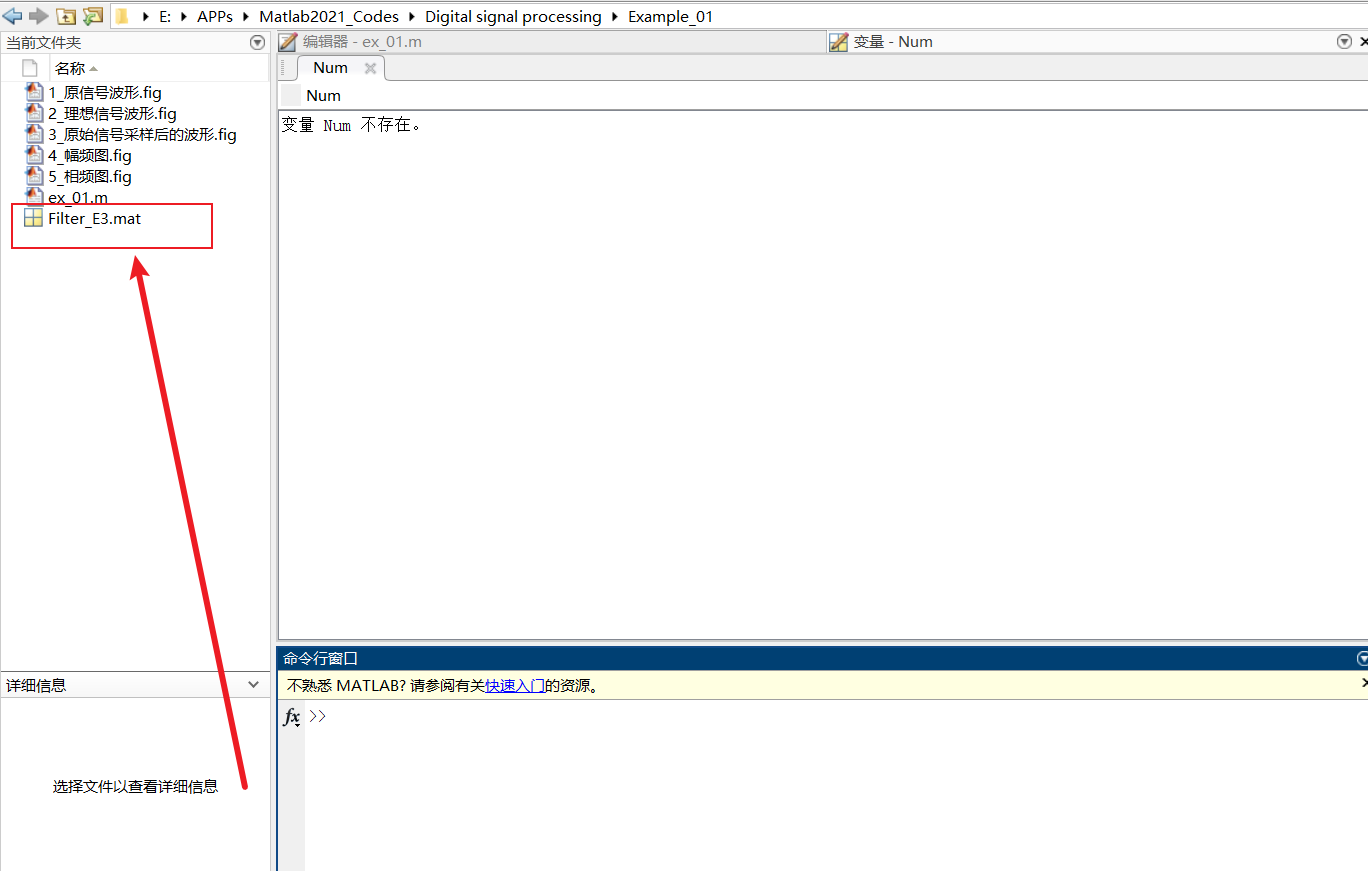
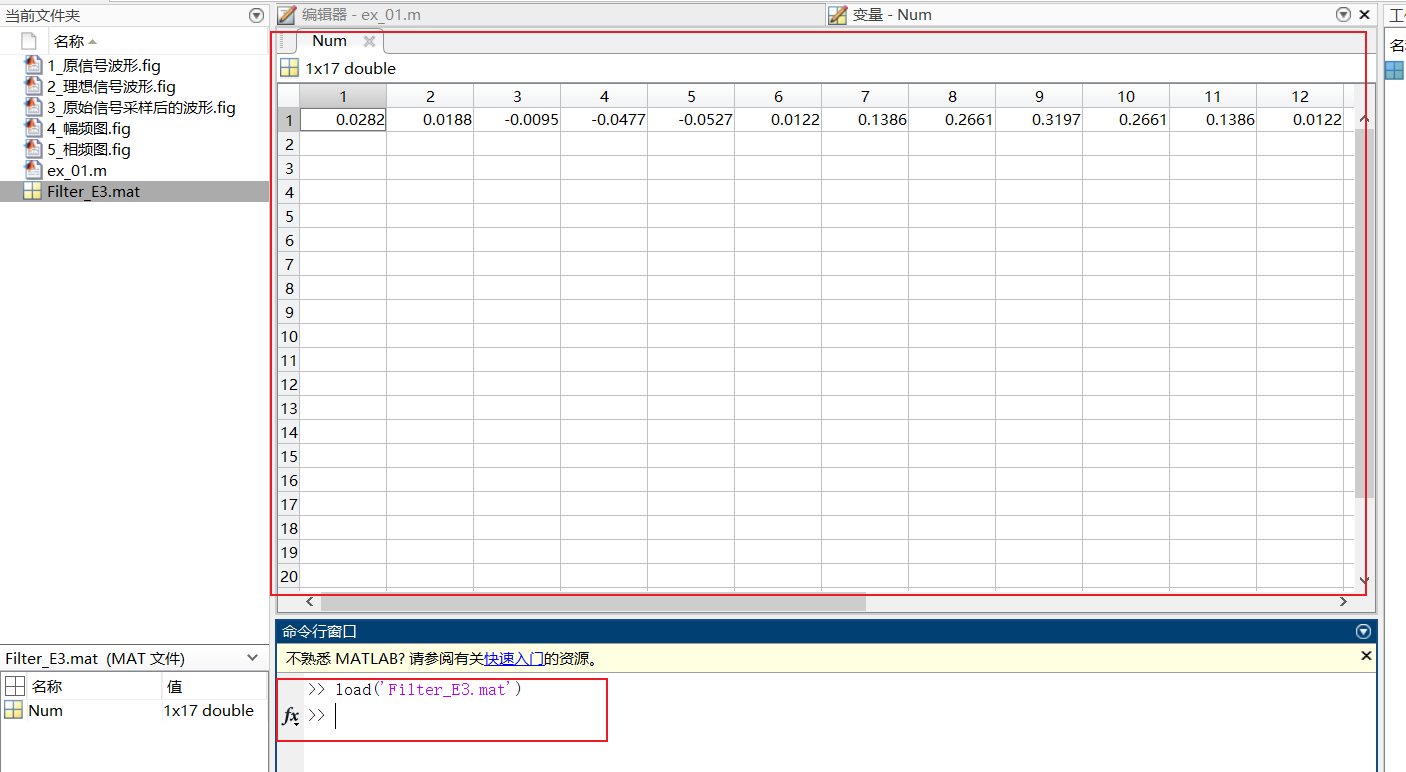
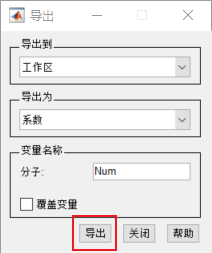
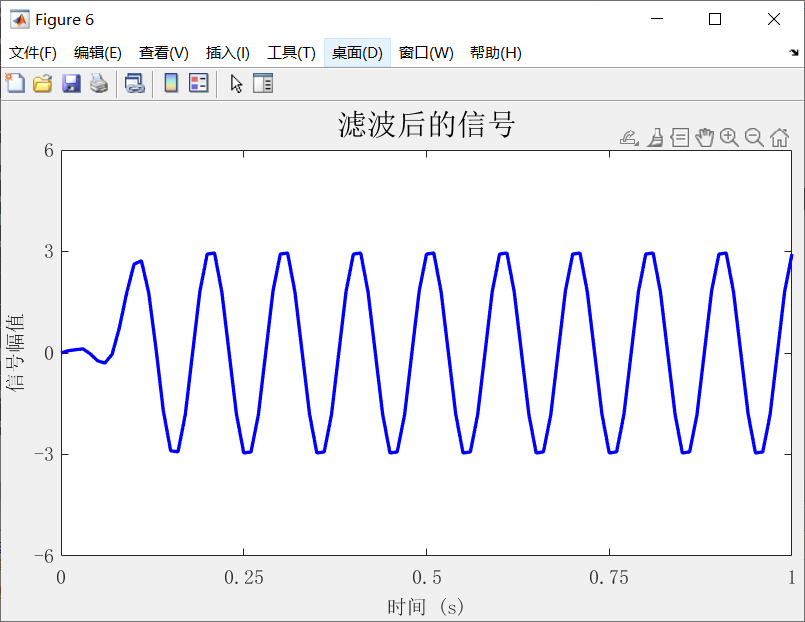
%% //滤波器低通滤波
load('Filter_E3.mat')
filteroce = Num;
y_Filter = filter(filteroce, 1, y);
% 绘制滤波后的信号
figure
set(gcf,'Unit','centimeters','Position',[3 3 3+figure_width 3+figure_height]);
set(gca,'LooseInset',get(gca,'TightInset')+[BiaValue,0,0,0],'FontName','Times New Roman','FontSize',font_size);
plot(t, y_Filter, 'b-', 'LineWidth', line_width)
set(gca,'FontSize',font_size,'FontName','Times New Roman')
xlim([0 1])
ylim([-6 6])
set(gca,'XTick',0:0.25:1)
set(gca,'YTick',-6:3:6)
xlabel('时间 (s)', 'FontSize', font_size, 'FontName', 'Times New Roman')
ylabel('信号幅值', 'FontSize', font_size, 'FontName', 'Times New Roman')
title('滤波后的信号', 'FontSize', font_size*1.5, 'FontName', 'Times New Roman')
set(gca,'Fontname','Monospaced'); %中文乱码问题
参考
数字信号处理_第1个编程实例_现代信号处理第一张程序设计-CSDN博客
【数字信号处理_第1个Matlab编程实例】 https://www.bilibili.com/video/BV1514y1w7Sw/?share_source=copy_web&vd_source=be33b1553b08cc7b94afdd6c8a50dc5a


:岭回归Ridge)


之使用教程(4)工具)
:)


