容器宽度(width),类型:number | string,默认 ‘100%’ 容器高度(height),类型:number | string,默认 ‘100%’
pnpm add @antv/x6
< script setup lang= "ts" >
import type { Edge, Graph as X6Graph, Node } from '@antv/x6'
import { Graph } from '@antv/x6'
import { useResizeObserver, debounce } from 'vue-amazing-ui' interface Props { width? : string | number height? : string | number
}
const props = withDefaults ( defineProps < Props> ( ) , { width: '100%' , height: '100%'
} )
const chartWidth = computed ( ( ) => { if ( typeof props. width === 'number' ) { return ` ${ props. width} px ` } return props. width
} )
const chartHeight = computed ( ( ) => { if ( typeof props. height === 'number' ) { return ` ${ props. height} px ` } return props. height
} ) const chartRef = useTemplateRef ( 'chartRef' )
let graph: X6Graph | null = null type DagNodeData = { label: string type: 'source' | 'transform' | 'sink' | 'hello' | string
} function getDefaultNodePorts ( ) { return { groups: { in : { position: 'left' , zIndex: 1 , attrs: { circle: { r: 4 , magnet: false , stroke: '#5F95FF' , strokeWidth: 1 , fill: '#fff' } } } , out: { position: 'right' , zIndex: 1 , attrs: { circle: { r: 4 , magnet: false , stroke: '#52c41a' , strokeWidth: 1 , fill: '#fff' } } } } , items: [ { id: 'in-1' , group: 'in' } , { id: 'out-1' , group: 'out' } ] }
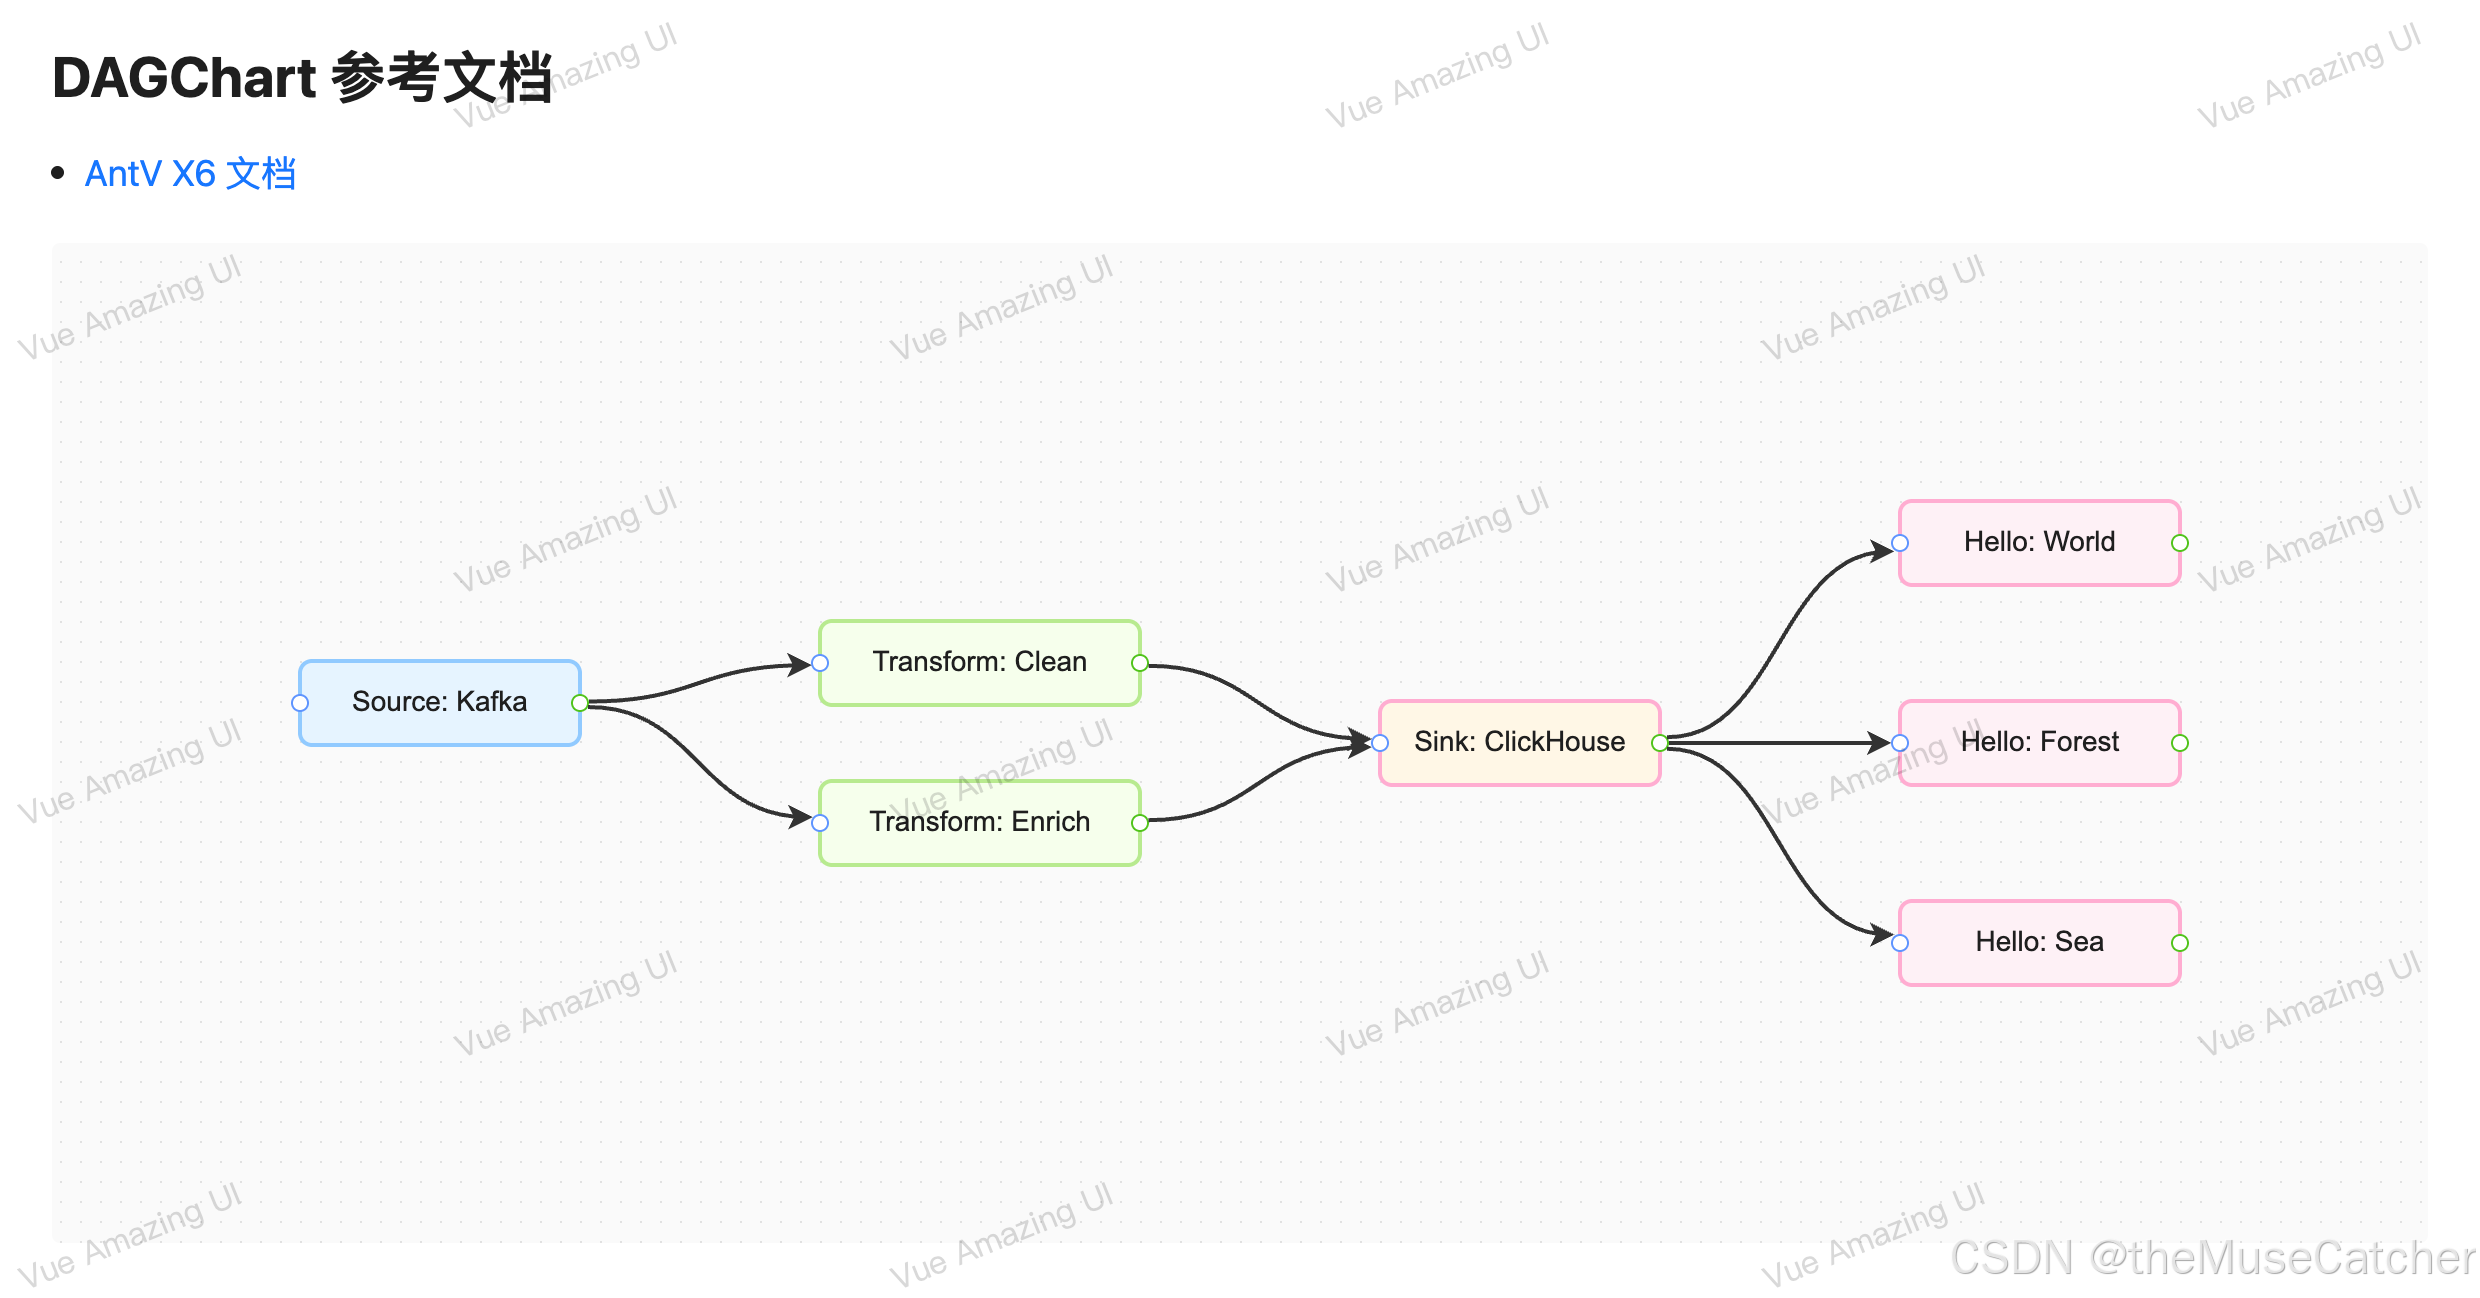
} function getGraphData ( ) { const nodes: Node. Metadata[ ] = [ { id: 'source-1' , shape: 'rect' , x: 80 , y: 140 , width: 140 , height: 42 , angle: 0 , data: { label: 'Source: Kafka' , type: 'source' } as DagNodeData, attrs: { body: { fill: '#e6f4ff' , stroke: '#91caff' , rx: 6 , ry: 6 } , label: { text: 'Source: Kafka' , fill: '#1f1f1f' } } , ports: getDefaultNodePorts ( ) } , { id: 'transform-1' , shape: 'rect' , x: 340 , y: 120 , width: 160 , height: 42 , data: { label: 'Transform: Clean' , type: 'transform' } as DagNodeData, attrs: { body: { fill: '#f6ffed' , stroke: '#b7eb8f' , rx: 6 , ry: 6 } , label: { text: 'Transform: Clean' , fill: '#1f1f1f' } } , ports: getDefaultNodePorts ( ) } , { id: 'transform-2' , shape: 'rect' , x: 340 , y: 200 , width: 160 , height: 42 , data: { label: 'Transform: Enrich' , type: 'transform' } as DagNodeData, attrs: { body: { fill: '#f6ffed' , stroke: '#b7eb8f' , rx: 6 , ry: 6 } , label: { text: 'Transform: Enrich' , fill: '#1f1f1f' } } , ports: getDefaultNodePorts ( ) } , { id: 'sink-1' , shape: 'rect' , x: 620 , y: 160 , width: 140 , height: 42 , data: { label: 'Sink: ClickHouse' , type: 'sink' } as DagNodeData, attrs: { body: { fill: '#fff7e6' , stroke: '#ffadd2' , rx: 6 , ry: 6 } , label: { text: 'Sink: ClickHouse' , fill: '#1f1f1f' } } , ports: getDefaultNodePorts ( ) } , { id: 'hello-1' , shape: 'rect' , x: 880 , y: 60 , width: 140 , height: 42 , data: { label: 'Hello: World' , type: 'hello' } as DagNodeData, attrs: { body: { fill: '#fff0f6' , stroke: '#ffadd2' , rx: 6 , ry: 6 } , label: { text: 'Hello: World' , fill: '#1f1f1f' } } , ports: getDefaultNodePorts ( ) } , { id: 'hello-2' , shape: 'rect' , x: 880 , y: 160 , width: 140 , height: 42 , data: { label: 'Hello: Forest' , type: 'hello' } as DagNodeData, attrs: { body: { fill: '#fff0f6' , stroke: '#ffadd2' , rx: 6 , ry: 6 } , label: { text: 'Hello: Forest' , fill: '#1f1f1f' } } , ports: getDefaultNodePorts ( ) } , { id: 'hello-3' , shape: 'rect' , x: 880 , y: 260 , width: 140 , height: 42 , data: { label: 'Hello: Sea' , type: 'hello' } as DagNodeData, attrs: { body: { fill: '#fff0f6' , stroke: '#ffadd2' , rx: 6 , ry: 6 } , label: { text: 'Hello: Sea' , fill: '#1f1f1f' } } , ports: getDefaultNodePorts ( ) } ] const edges: Edge. Metadata[ ] = [ { id: 'edge-1' , source: { cell: 'source-1' , port: 'out-1' } , target: { cell: 'transform-1' , port: 'in-1' } , connector: { name: 'smooth' } } , { id: 'edge-2' , source: { cell: 'source-1' , port: 'out-1' } , target: { cell: 'transform-2' , port: 'in-1' } , connector: { name: 'smooth' } } , { id: 'edge-3' , source: { cell: 'transform-1' , port: 'out-1' } , target: { cell: 'sink-1' , port: 'in-1' } , connector: { name: 'smooth' } } , { id: 'edge-4' , source: { cell: 'transform-2' , port: 'out-1' } , target: { cell: 'sink-1' , port: 'in-1' } , connector: { name: 'smooth' } } , { id: 'edge-5' , source: { cell: 'sink-1' , port: 'out-1' } , target: { cell: 'hello-1' , port: 'in-1' } , connector: { name: 'smooth' } } , { id: 'edge-6' , source: { cell: 'sink-1' , port: 'out-1' } , target: { cell: 'hello-2' , port: 'in-1' } , connector: { name: 'smooth' } } , { id: 'edge-7' , source: { cell: 'sink-1' , port: 'out-1' } , target: { cell: 'hello-3' , port: 'in-1' } , connector: { name: 'smooth' } } ] return { nodes, edges }
} function initGraph ( ) { if ( ! chartRef. value) return graph = new Graph ( { container: chartRef. value, grid: { visible: true , size: 10 , type: 'dot' , args: { color: '#ddd' , thickness: 1 } } , background: { color: '#fafafa' } , panning: true , mousewheel: true , interacting: { nodeMovable: true , edgeMovable: false , vertexMovable: false , edgeLabelMovable: false } , autoResize: true } ) graph. on ( 'node:click' , ( { node } ) => { const data = ( node. getData ? node. getData ( ) : node. getData) as DagNodeData | undefined console . log ( ` 节点被点击: ${ data?. label} ` ) } ) const data = getGraphData ( ) graph. fromJSON ( data) fitView ( ) centerView ( ) useResizeObserver ( chartRef, debounce ( ( ) => { console . log ( 'centerView' ) fitView ( ) centerView ( ) } , 100 ) as ResizeObserverCallback)
}
function zoomIn ( ) { graph?. zoom ( 0.1 )
}
function zoomOut ( ) { graph?. zoom ( - 0.1 )
}
function fitView ( ) { graph?. zoomToFit ( { padding: 20 , maxScale: 1 } )
}
function centerView ( ) { graph?. centerContent ( )
}
onMounted ( ( ) => { initGraph ( )
} )
onBeforeUnmount ( ( ) => { graph?. dispose ( ) graph = null
} )
< / script>
< template> < div class = "dag-container" > < divref= "chartRef" class = "graph-container" : style= "`--chart-width: ${chartWidth}; --chart-height: ${chartHeight};`" > < / div> < / div>
< / template>
< style lang= "less" scoped>
. dag- container { . graph- container { width: var ( -- chart- width) ! important; height: var ( -- chart- height) ! important; padding: 16px 24px; border- radius: 4px; }
}
< / style>
< script setup lang= "ts" >
import DAGChart from './DAGChart.vue'
< / script>
< template> < div> < h1> DAGChart 参考文档< / h1> < ul class = "m-list" > < li> < a class = "u-file" href= "https://x6.antv.antgroup.com/tutorial/about" target= "_blank" > AntV X6 文档< / a> < / li> < / ul> < DAGChart : height= "500" / > < / div>
< / template>


:)


启动时提示Netty的某些类找不到)
- KMS drm_crtc.c)
)


)

)


