目录
一、实现效果
二、实现步骤
1. 安装ECharts和Liquid Fill插件
2. 创建一个组件
3.在创建的vue中引入ECharts和Liquid Fill插件
4.在组件中初始化ECharts和Liquid Fill插件
5.完整代码
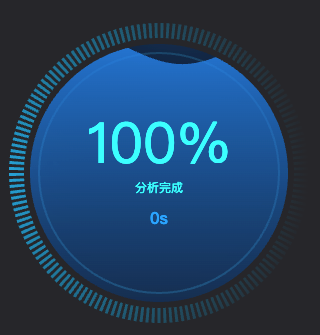
一、实现效果
Echarts中的水位图(水波图、水球图、水半球)实现的详细步骤,先看实现效果:
二、实现步骤
1. 安装ECharts和Liquid Fill插件
使用npm安装ECharts和Liquid Fill插件。
npm install echarts echarts-liquidfill2. 创建一个组件
创建组件便于后续的复用
3.在创建的vue中引入ECharts和Liquid Fill插件
import echarts from 'echarts';import 'echarts-liquidfill';4.在组件中初始化ECharts和Liquid Fill插件
<script>
import * as echarts from 'echarts';
import 'echarts-liquidfill'; // 引入液体填充插件export default {name: 'WaterBallChart',mounted() {this.initChart();},methods: {initChart() {const myChart = echarts.init(this.$refs.chart);// 配置项const option = {series: [{type: 'liquidFill',//设置图表类型data: [0.6], // 设置水位,值为0到1之间radius: '80%', // 设置图的大小outline: {borderDistance: 4, // 外边框距离itemStyle: {borderWidth: 2, // 外边框宽度borderColor: '#156ACF' // 外边框颜色}},backgroundStyle: {color: '#E3F7FF' // 背景色},label: {normal: {textStyle: {color: '#156ACF',//标签文本颜色insideColor: '#fff',fontSize: 40}}}}]};// 使用配置项设置图表myChart.setOption(option);}}
};
</script>
5.完整代码
<template><div ref="pieChartRef" class="chart-container"></div>
</template><script lang="ts" setup>
import { useDebounceFn } from '@vueuse/core'
import * as echarts from 'echarts'
import 'echarts-liquidfill'
import { onMounted, ref, watch, computed, onBeforeUnmount } from 'vue'
const props = defineProps({progress: {type: Number,default: 0,validator: (value: number) => {return Number(value.toFixed(2)) === value}}
})
const chartInstance = ref<echarts.ECharts | null>(null)
const pieChartRef = ref<HTMLElement | null>(null)
const isMounted = ref(false)
const simulatedSeconds = ref(0)
let timer: number | null = null // 定时器// 格式化时间
const formatTime = (seconds: number): string => {const days = Math.floor(seconds / 86400)const hours = Math.floor((seconds % 86400) / 3600)const minutes = Math.floor((seconds % 3600) / 60)const secs = seconds % 60const parts = []if (days > 0) parts.push(`${days}d`)if (hours > 0) parts.push(`${hours}h`)if (minutes > 0) parts.push(`${minutes}m`)parts.push(`${secs}s`)return parts.join(' ')
}
const clearTimer = () => {if (timer) {clearInterval(timer)timer = null}
}const startTimer = () => {if (!timer && isMounted.value) {timer = setInterval(() => {if (props.progress < 100) {simulatedSeconds.value += 1updateChart()}}, 1000) as any}
}
const safeUpdateChart = () => {if (!isMounted.value || !pieChartRef.value || !chartInstance.value) returnsimulatedSeconds.value += 0updateChart()
}
const initChart = () => {if (pieChartRef.value) {chartInstance.value = echarts.init(pieChartRef.value)updateChart()}
}
const updateChart = () => {if (!chartInstance.value) returnconst showProgress = props.progress >= 100 ? 1 : props.progress / 100const showWave = props.progress >= 100 ? 0.98 : showProgressconst showStatus = props.progress >= 100 ? '分析完成' : 'AI识别中...'const waterGradient = new echarts.graphic.LinearGradient(0, 0, 0, 1,[{ offset: 0, color: 'rgba(42, 139, 250, 1)' },{ offset: 1, color: 'rgba(42, 139, 250, 0)' }])const option = {series: [{type: 'liquidFill',data: [{value: showWave,direction: 'left',itemStyle: {color: waterGradient,opacity: 0.8},emphasis: {itemStyle: {color: waterGradient,opacity: 1}},amplitude: 15,waveLength: '80%',phase: 'auto',period: (_: any, i: number) => 2000 + i * 500,itemCount: 3}],waveAnimation: true,radius: '80%',outline: {show: true,borderDistance: -10,itemStyle: {borderWidth: 2,borderColor: '#4EC9F2FF'}},backgroundStyle: {color: '#123059CC'},label: {normal: {formatter: `{percent|${props.progress}%}\n{a|${showStatus}}\n{b|${formatTime(simulatedSeconds.value)}}`,rich: {percent: {fontSize: 56,color: '#00FFFFFF',lineHeight: 60},a: {fontSize: 12,color: '#00FFFFFF',lineHeight: 30},b: {fontSize: 16,color: 'rgba(0, 164, 255, 1)',fontWeight: '700',lineHeight: 30}}}}}]}chartInstance.value.setOption(option, true)
}
const resizeHandler = useDebounceFn(() => {chartInstance.value?.resize()
}, 300)watch(() => props.progress, (newVal) => {if (newVal >= 100) {clearTimer()updateChart()}
})onMounted(() => {console.log('水球组件挂载了')isMounted.value = trueinitChart()startTimer()window.addEventListener('resize', resizeHandler)
})onBeforeUnmount(() => {console.log('水球组件被卸载了')isMounted.value = falsewindow.removeEventListener('resize', resizeHandler)clearTimer()chartInstance.value?.dispose()
})
</script><style lang="scss" scoped>
.chart-container {width: 300px;height: 360px;background: url('@/assets/images/svg/analysis-echarts-bg.svg') no-repeat center center;background-size: contain;position: relative;.completion-marker {position: absolute;top: 54%;left: 39%;transform: translate(-50%, -50%);font-size: 18px;color: #24BD61;text-shadow: 0 0 20px rgba(36, 189, 97, 0.5);z-index: 2;}// 覆盖水球层叠顺序canvas {position: relative;z-index: 1;}
}
</style>


提取环境因子)
