关键点:
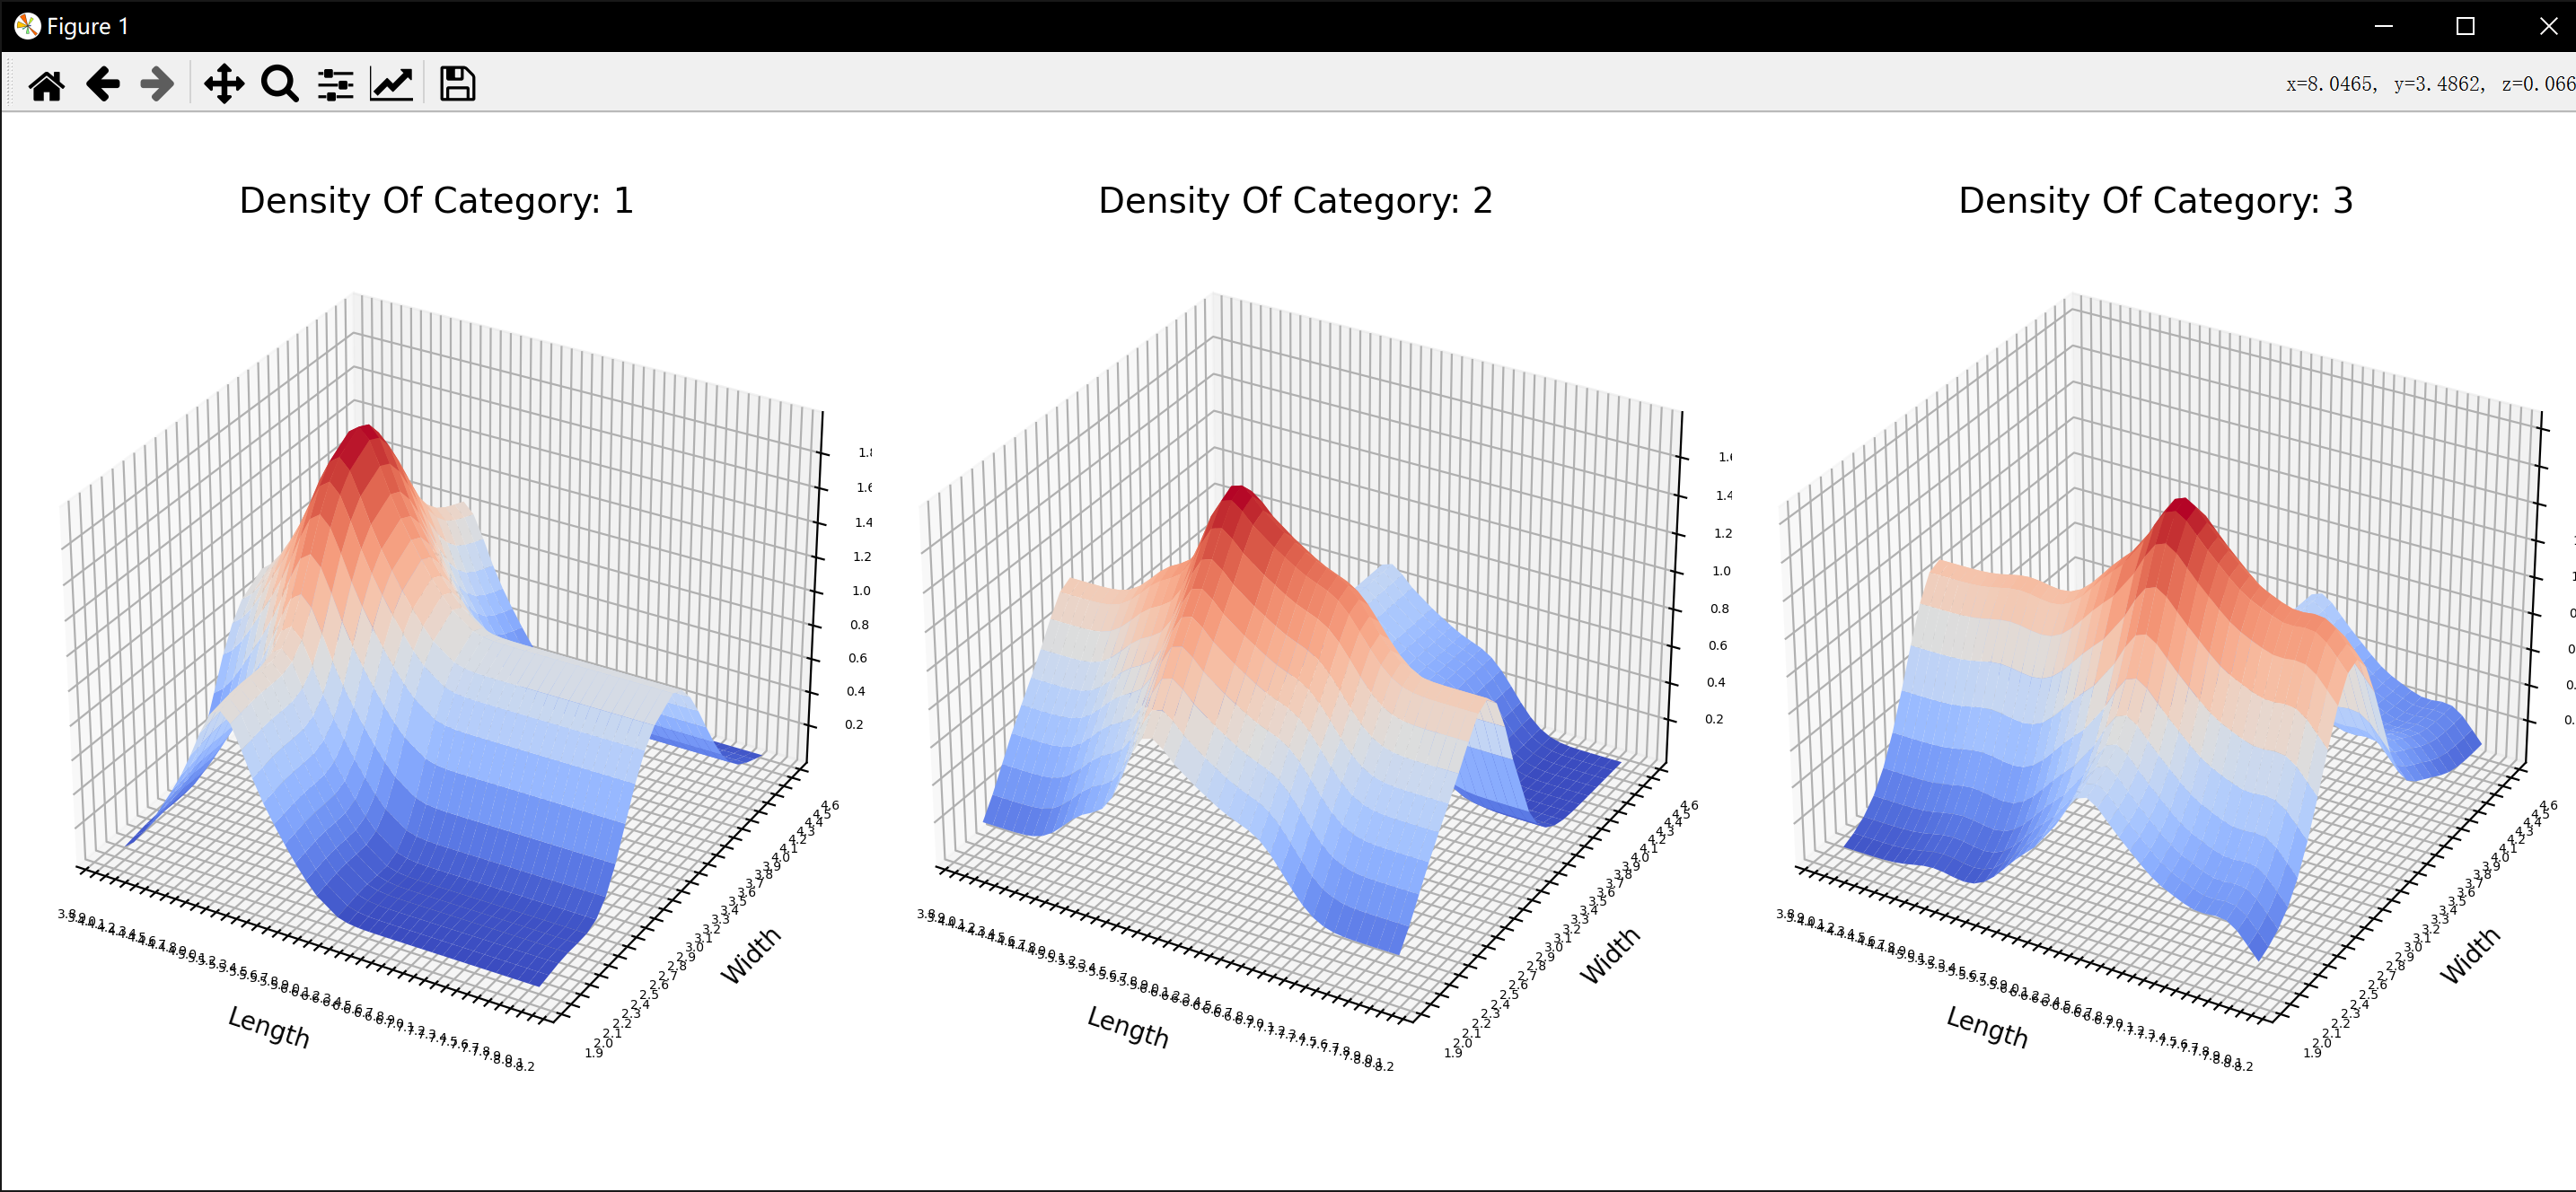
使用核密度估计(KDE) 估计类别条件概率密度(高斯核,带宽=0.2)
采用最大后验概率(MAP) 决策准则进行分类
程序代码:
import random
import matplotlib
from sklearn.neighbors import KernelDensity
import numpy as np
import matplotlib.pyplot as plt
from matplotlib.ticker import MultipleLocatordata_dict = {}
train_data = {}
test_data = {}matplotlib.rcParams.update({'font.size': 5})   #整体原始字体大小'''
加载数据形成字典,并且随机打乱形成每类训练数据45个,测试数据5个
'''
with open('Iris数据txt版.txt', 'r') as file:for line in file:line = line.strip()data = line.split('\t')if len(data) >= 3:try:category = data[0]attribute1 = eval(data[1])attribute2 = eval(data[2])if category not in data_dict:data_dict[category] = {'Length': [], 'Width': []}data_dict[category]['Length'].append(attribute1)data_dict[category]['Width'].append(attribute2)except ValueError:print(f"Invalid data in line: {line}")continue
for category, attributes in data_dict.items():print(f'种类: {category}')print(len(attributes["Length"]))print(len(attributes["Width"]))print(f'属性1: {attributes["Length"]}')print(f'属性2: {attributes["Width"]}')for category, attributes in data_dict.items():lengths = attributes['Length']widths = attributes['Width']train_indices = random.sample(range(len(lengths)), 45)test_indices = [i for i in range(len(lengths)) if i not in train_indices]train_data[category] = {'Length': [lengths[i] for i in train_indices],'Width': [widths[i] for i in train_indices]}test_data[category] = {'Length': [lengths[i] for i in test_indices],'Width': [widths[i] for i in test_indices]}prior_rate = 1.0/len(data_dict)
#print("训练数据:")
#print(train_data)
#print(train_data['1']['Length'])
#print(train_data['1']['Width'])
#print(len(train_data['1']['Length']))
#print("测试数据:")
#print(test_data)
#print(test_data['1']['Length'])
#print(test_data['1']['Width'])
#print(len(test_data['1']['Length']))'''
使用Python自带的k近邻法(KNN算法)计算概率密度
'''
knn_models = {}
smoothed_data = {}for category, attributes in train_data.items():lengths = np.array(attributes['Length']).reshape(-1, 1)widths = np.array(attributes['Width']).reshape(-1, 1)knn_length = KernelDensity(kernel='gaussian', bandwidth=0.2).fit(lengths)knn_width = KernelDensity(kernel='gaussian', bandwidth=0.2).fit(widths)knn_models[category] = {'Length': knn_length, 'Width': knn_width}length_range = np.around(np.linspace(4, 8, 40), 1)width_range = np.around(np.linspace(2, 4.5, 25), 1)length_mesh, width_mesh = np.meshgrid(length_range, width_range)log_density_length = knn_length.score_samples(length_mesh.reshape(-1, 1))log_density_width = knn_width.score_samples(width_mesh.reshape(-1, 1))total_density = np.exp(log_density_length) + np.exp(log_density_width)total_density = total_density.reshape(length_mesh.shape)smoothed_data[category] = {'Length': length_mesh, 'Width': width_mesh, 'ProbabilityDensity': total_density}fig, axs = plt.subplots(1, 3, figsize=(18, 6), subplot_kw={'projection': '3d'})for idx, (category, data) in enumerate(smoothed_data.items()):ax = axs[idx]ax.set_title(f'Density Of Category: {category}',fontsize = 14)ax.plot_surface(data['Length'], data['Width'], data['ProbabilityDensity'], cmap='coolwarm')x_major_locator = MultipleLocator(0.1)y_major_locator = MultipleLocator(0.1)z_major_locator = MultipleLocator(0.2)ax.xaxis.set_major_locator(x_major_locator)ax.yaxis.set_major_locator(y_major_locator)ax.zaxis.set_major_locator(z_major_locator)ax.set_xlabel('Length',fontsize = 10)ax.set_ylabel('Width',fontsize = 10)ax.set_zlabel('ProbabilityDensity',fontsize = 10)plt.tight_layout()
plt.show()right = 0
all = 0for category1,data1 in test_data.items():print(category1,data1)for i,j in zip(data1['Length'],data1['Width']):desired_probability_density = {}for idx,(category2, data2) in enumerate(smoothed_data.items()):length_mesh = data2['Length']width_mesh = data2['Width']probability_density = data2['ProbabilityDensity']#获取长度、宽度和概率密度数据length_index = np.abs(length_mesh[0] - i).argmin()width_index = np.abs(width_mesh[:, 0] - j).argmin()#找对应的索引desired_probability_density[category2] = probability_density[width_index, length_index]#用索引找对应的概率密度predict = max(desired_probability_density,key = desired_probability_density.get)#取后验概率最大的类别print(category1,predict)all += 1if category1 == predict:right += 1print("正确率:",right/all)
运行结果:
种类: 1
50
50
属性1: [5.1, 4.9, 4.7, 4.6, 5.0, 5.4, 4.6, 5.0, 4.4, 4.9, 5.4, 4.8, 4.8, 4.3, 5.8, 5.7, 5.4, 5.1, 5.7, 5.1, 5.4, 5.1, 4.6, 5.1, 4.8, 5.0, 5.0, 5.2, 5.2, 4.7, 4.8, 5.4, 5.2, 5.5, 4.9, 5.0, 5.5, 4.9, 4.4, 5.1, 5.0, 4.5, 4.4, 5.0, 5.1, 4.8, 5.1, 4.6, 5.3, 5.0]
属性2: [3.5, 3.0, 3.2, 3.1, 3.6, 3.9, 3.4, 3.4, 2.9, 3.1, 3.7, 3.4, 3.0, 3.0, 4.0, 4.4, 3.9, 3.5, 3.8, 3.8, 3.4, 3.7, 3.6, 3.3, 3.4, 3.0, 3.4, 3.5, 3.4, 3.2, 3.1, 3.4, 4.1, 4.2, 3.1, 3.2, 3.5, 3.6, 3.0, 3.4, 3.5, 2.3, 3.2, 3.5, 3.8, 3.0, 3.8, 3.2, 3.7, 3.3]
种类: 2
50
50
属性1: [7.0, 6.4, 6.9, 5.5, 6.5, 5.7, 6.3, 4.9, 6.6, 5.2, 5.0, 5.9, 6.0, 6.1, 5.6, 6.7, 5.6, 5.8, 6.2, 5.6, 5.9, 6.1, 6.3, 6.1, 6.4, 6.6, 6.8, 6.7, 6.0, 5.7, 5.5, 5.5, 5.8, 6.0, 5.4, 6.0, 6.7, 6.3, 5.6, 5.5, 5.5, 6.1, 5.8, 5.0, 5.6, 5.7, 5.7, 6.2, 5.1, 5.7]
属性2: [3.2, 3.2, 3.1, 2.3, 2.8, 2.8, 3.3, 2.4, 2.9, 2.7, 2.0, 3.0, 2.2, 2.9, 2.9, 3.1, 3.0, 2.7, 2.2, 2.5, 3.2, 2.8, 2.5, 2.8, 2.9, 3.0, 2.8, 3.0, 2.9, 2.6, 2.4, 2.4, 2.7, 2.7, 3.0, 3.4, 3.1, 2.3, 3, 2.5, 2.6, 3.0, 2.6, 2.3, 2.7, 3.0, 2.9, 2.9, 2.5, 2.8]
种类: 3
50
50
属性1: [6.3, 5.8, 7.1, 6.3, 6.5, 7.6, 4.9, 7.3, 6.7, 7.2, 6.5, 6.4, 6.8, 5.7, 5.8, 6.4, 6.5, 7.7, 7.7, 6.0, 6.9, 5.6, 7.7, 6.3, 6.7, 7.2, 6.2, 6.1, 6.4, 7.2, 7.4, 7.9, 6.4, 6.3, 6.1, 7.7, 6.3, 6.4, 6.0, 6.9, 6.7, 6.9, 5.8, 6.8, 6.7, 6.7, 6.3, 6.5, 6.2, 5.9]
属性2: [3.3, 2.7, 3.0, 2.9, 3.0, 3.0, 2.5, 2.9, 2.5, 3.6, 3.2, 2.7, 3.0, 2.5, 2.8, 3.2, 3.0, 3.8, 2.6, 2.2, 3.2, 2.8, 2.8, 2.7, 3.3, 3.2, 2.8, 3.0, 2.8, 3.0, 2.8, 3.8, 2.8, 2.8, 2.6, 3.0, 3.4, 3.1, 3.0, 3.1, 3.1, 3.1, 2.7, 3.2, 3.3, 3, 2.5, 3, 3.4, 3]
1 {'Length': [5.1, 5.0, 5.4, 5.1, 5.1], 'Width': [3.3, 3.0, 3.4, 3.4, 3.8]}
1 1
1 1
1 1
1 1
1 1
2 {'Length': [6.5, 5.4, 6.7, 5.6, 5.1], 'Width': [2.8, 3.0, 3.1, 3, 2.5]}
2 3
2 2
2 3
2 2
2 1
3 {'Length': [5.8, 6.9, 7.4, 6.4, 6.9], 'Width': [2.7, 3.2, 2.8, 3.1, 3.1]}
3 2
3 3
3 3
3 3
3 3
正确率: 0.7333333333333333进程已结束,退出代码0


=>TIM+DAC+ADC+DMA正弦波回环测试)


)
![学习:JS[8]本地存储+正则表达式](http://pic.xiahunao.cn/学习:JS[8]本地存储+正则表达式)