create_scatterplotmatrix
对角线是直方图,但是框选无交互
import plotly.figure_factory as fffig = ff.create_scatterplotmatrix(df, diag='histogram', # 将对角线设置为直方图)fig.update_layout(autosize=True, # 让 Plotly 自动适应容器width=None, # 设置宽度height=None # 设置高度)fig.write_html("./static/pairplot.html", include_plotlyjs='./js/plotly.js')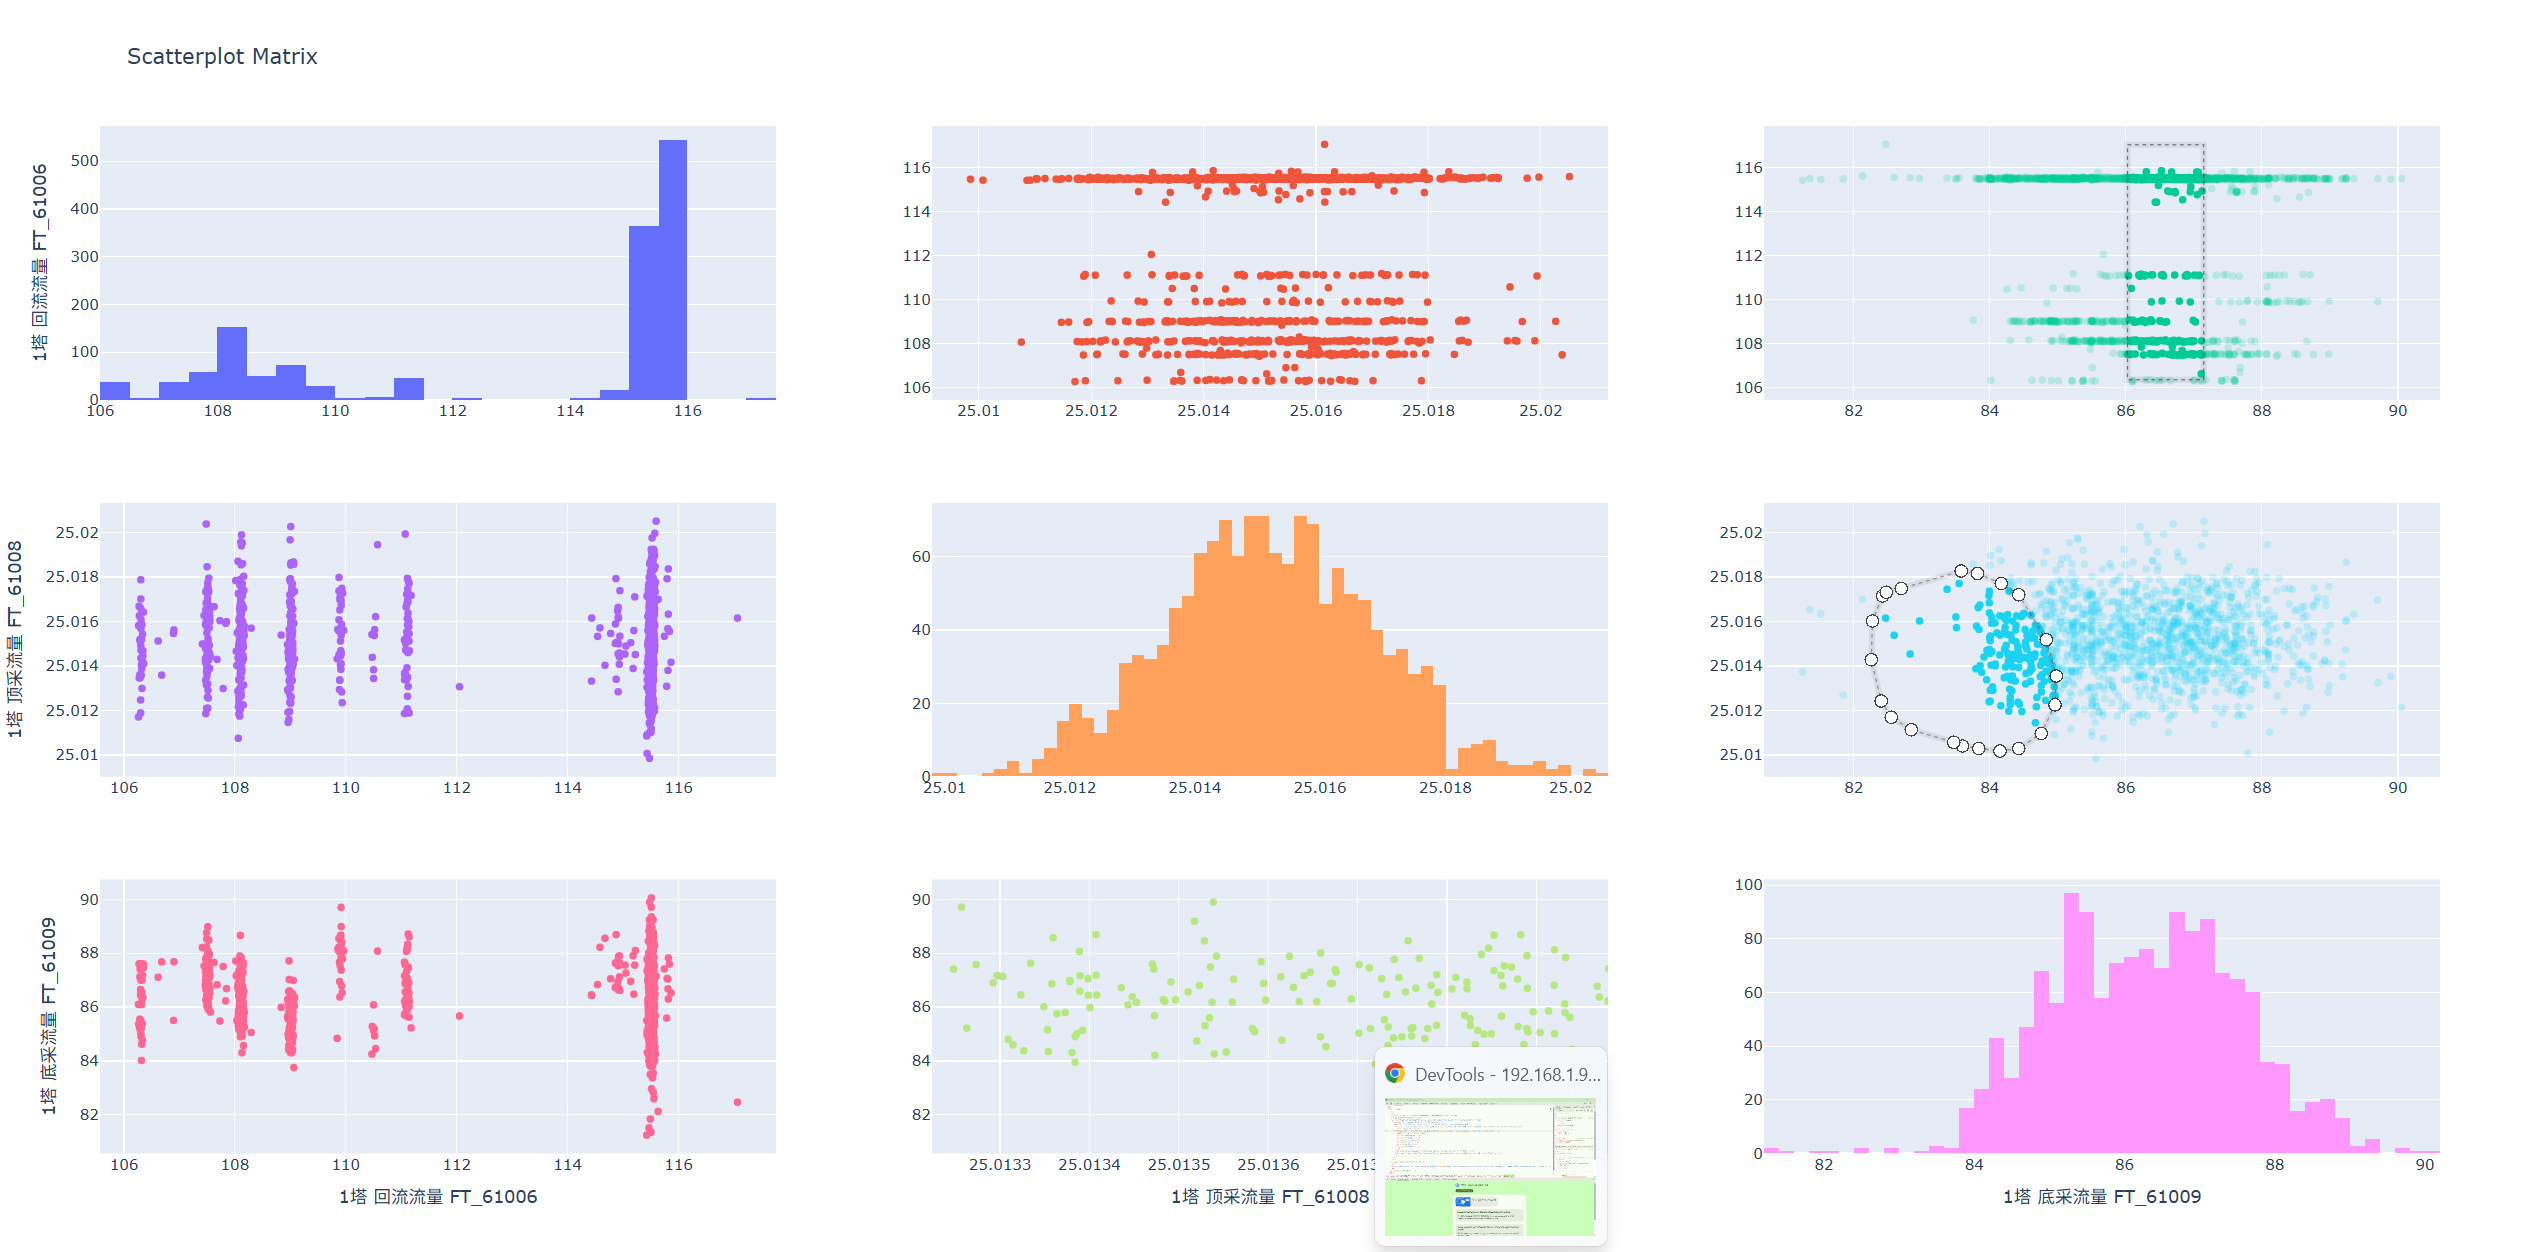
scatter_matrix
对角线不是直方图,但是框选有交互
fig = px.scatter_matrix(df)fig.update_traces(selected=dict(marker=dict(color='red', # 选中点变为红色opacity=1, # 不透明度设为 1(完全不透明)# size=8 # 可以调整选中点的大小)),unselected=dict(marker=dict(opacity=0.1, # 未选中点变半透明color='blue' # 未选中点颜色(可选))))fig.update_layout(dragmode='select', # 启用选择模式clickmode='event+select' # 允许点击选择)fig.write_html("./static/pairplot.html", include_plotlyjs='./js/plotly.js')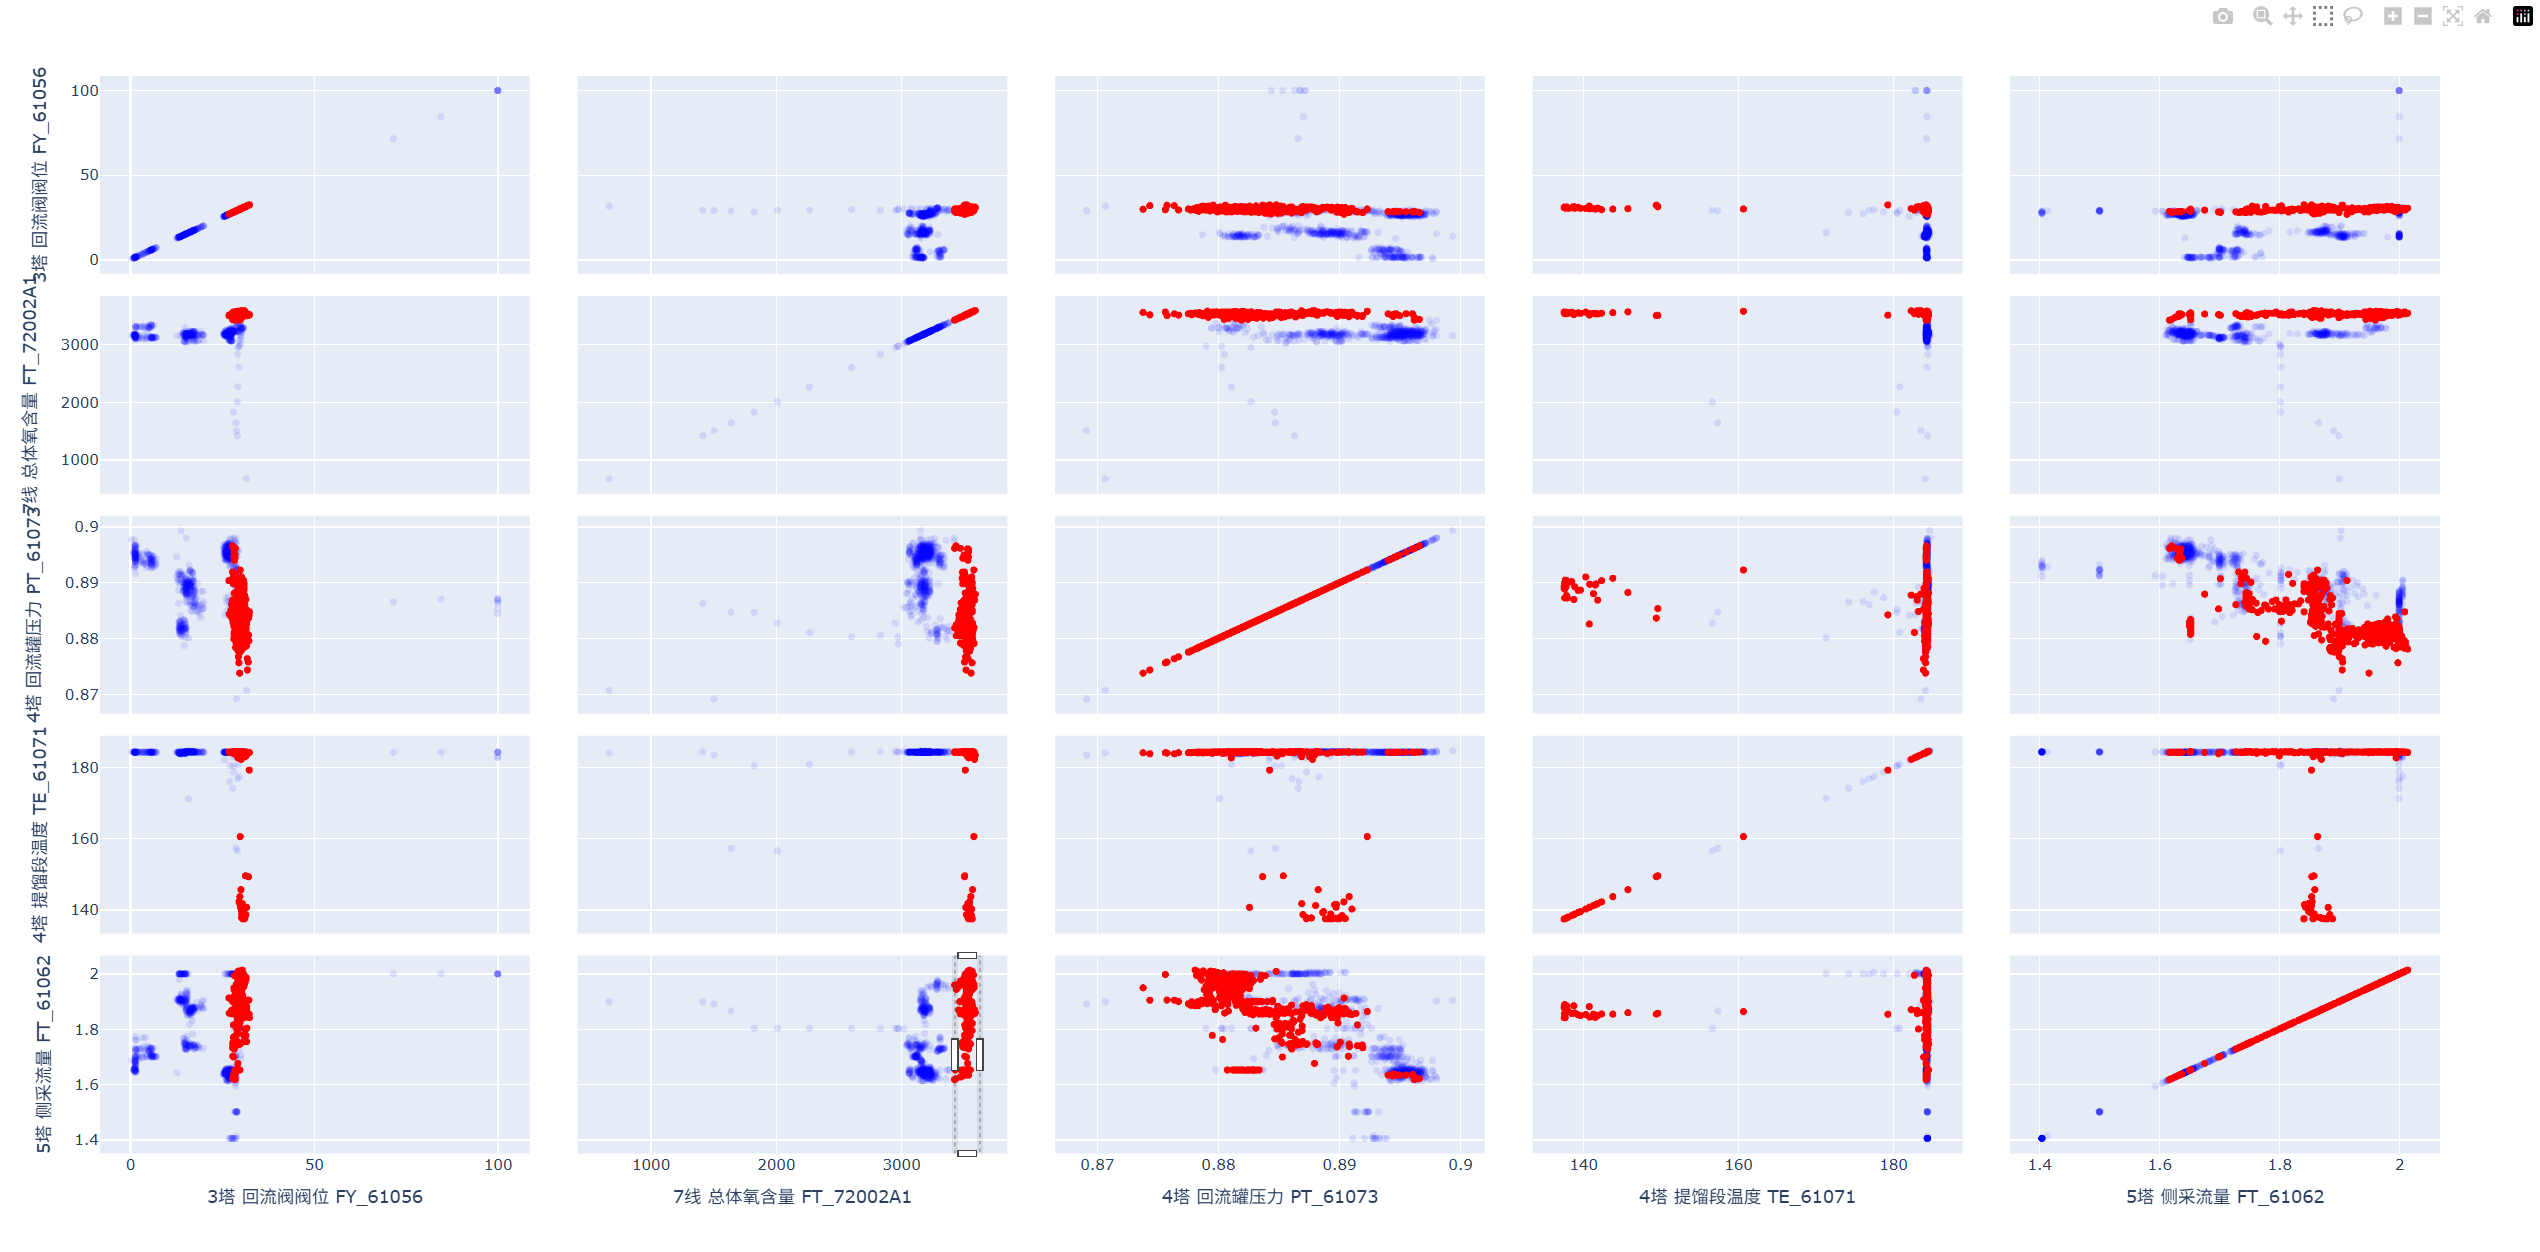


 -> enabled)


)

)