Title
题目
SpinFlowSim: A blood flow simulation framework for histology-informeddiffusion MRI microvasculature mapping in cancer
SpinFlowSim:用于癌症组织学信息驱动的扩散MRI微血管映射的血流模拟框架
01
文献速递介绍
在扩散磁共振成像(dMRI)中,水质子的运动通过磁场梯度编码到采集的信号中(Kiselev, 2017)。扩散编码不仅对纯扩散引起的布朗运动敏感,还对血流质子通过复杂毛细血管网络的非相干流动所产生的伪扩散效应敏感(Le Bihan 等, 1986)。通过伪随机分布毛细血管的流动会导致dMRI信号幅度衰减,这一现象被称为体素内不相干运动(IVIM)效应。IVIM使得通过dMRI在体表征微血管灌注成为可能(Le Bihan, 2019),这在多种疾病中具有重要意义,例如癌症(Fokkinga 等, 2024)。癌症的特征是异常的微血管系统,其血流模式可能与正常组织有显著差异(Munn, 2003)。肿瘤血管是抗血管生成治疗的特定靶点,这类治疗已应用于多种癌症(如肝癌或肾癌(Jayson 等, 2016)),并正在与免疫检查点抑制剂等疗法联合测试,取得了有希望的结果(Huinen 等, 2021)。通过dMRI对血管特性进行非侵入性评估,可为医生提供肿瘤表征和纵向评估的新工具。因此,这是一个活跃的研究领域,研究范围从恶性肿瘤检测到治疗反应评估(Iima 等, 2018; Perucho 等, 2021)。 IVIM方法通常依赖于从血管外组织dMRI信号中分离出血管信号(Barbieri 等, 2016b,a)。多指数模型常用于此目的,提供诸如血管信号分数f_v或伪扩散(血管)表观扩散系数(ADC)D∗等指标,最近通过深度学习已使这些指标的估计更加稳健(Barbieri 等, 2020; Zheng 等, 2023)。f_v和D∗都是有用的指标,因为它们在癌症评估中已显示出价值(Dappa 等, 2017)。然而,这些指标存在局限性,因为它们将多种不同的微血管特征纠缠为单个数值,例如在扩散流动状态下血流速度平均值与毛细血管长度分布的乘积(Le Bihan 和 Turner, 1992-09)。此外,它们不考虑扩散衰减的高阶累积量(例如与b²成比例的峰度项),且其实际数值可能以复杂的方式依赖于采集协议(Wu 和 Zhang, 2019)。实际上,这使得常规IVIM指标成为半定量的替代参数,这一事实连同其已知的高可变性(Barbieri 等, 2020),阻碍了它们的大规模临床应用。 最近,在组织学真实的体素模型中对dMRI信号进行数值模拟正越来越多地用于指导参数估计(Nilsson 等, 2010; Nguyen 等, 2014; Fieremans 和 Lee, 2018; Buizza 等, 2021; Morelli 等, 2023)。模拟指导的方法增加了信号模型的真实性,从而可能提高dMRI参数图的生物学保真度(Nedjati-Gilani 等, 2017; Palombo 等, 2019)。然而,迄今为止,dMRI模拟主要由蒙特卡洛布朗随机游走主导(Hall 和 Alexander, 2009; Ginsburger 等, 2019; Rafael-Patino 等, 2020; Lee 等, 2021)。鉴于只有少数模拟框架专注于血流(Van 等, 2021; Weine 等, 2024),迫切需要针对血流产生的dMRI信号、具有组织学意义且可重复的新型模拟器。这些模拟器可用于指导基于dMRI的非侵入性微血管映射新数值方法,为临床环境中的肿瘤学家提供具有生物学意义的血管标志物。新的dMRI方法可实现对经典IVIM f_v和D∗未捕捉到的毛细血管流动模式的表征,例如提供关于各向异性流动模式、高阶累积量或血管信号扩散时间依赖性的信息。 本文旨在填补这一科学空白。我们提出了一个用于血管网络内血流模拟的开源框架,此后称为SpinFlowSim,并展示了其在dMRI中指导微血管特性估计的潜力。我们首先阐述SpinFlowSim背后基于管道网络理论的计算引擎,然后描述从人类肿瘤组织学图像获得的真实血管网络内流动产生的dMRI信号的合成过程。最后,我们通过使用合成信号指导微血管特性估计,展示了SpinFlowSim的潜在应用,该应用在健康志愿者和癌症患者中通过计算机模拟和体内实验进行了验证。初步研究结果已以摘要形式在会议上发表(Voronova 等, 2024b),本文的草稿也已作为预印本发布在medRxiv服务器上(Voronova 等, 2024a)。
Abatract
摘要
Diffusion Magnetic Resonance Imaging (dMRI) sensitises the MRI signal to spin motion. This includes Browniandiffusion, but also flow across intricate networks of capillaries. This effect, the intra-voxel incoherent motion(IVIM), enables microvasculature characterisation with dMRI, through metrics such as the vascular signalfraction 𝑓𝑉 or the vascular Apparent Diffusion Coefficient (ADC) 𝐷∗ . The IVIM metrics, while sensitive toperfusion, are protocol-dependent, and their interpretation can change depending on the flow regime spinsexperience during the dMRI measurements (e.g., diffusive vs ballistic), which is in general not known for agiven voxel. These facts hamper their practical clinical utility, and innovative vascular dMRI models are neededto enable the in vivo calculation of biologically meaningful markers of capillary flow. These could have relevantapplications in cancer, as in the assessment of the response to anti-angiogenic therapies targeting tumourvessels. This paper tackles this need by introducing SpinFlowSim, an open-source simulator of dMRI signalsarising from blood flow within pipe networks. SpinFlowSim, tailored for the laminar flow patterns withincapillaries, enables the synthesis of highly-realistic microvascular dMRI signals, given networks reconstructedfrom histology. We showcase the simulator by generating synthetic signals for 15 networks, reconstructedfrom liver biopsies, and containing cancerous and non-cancerous tissue. Signals exhibit complex, non-monoexponential behaviours, consistent with in vivo signal patterns, and pointing towards the co-existence ofdifferent flow regimes within the same network, as well as diffusion time dependence. We also demonstratethe potential utility of SpinFlowSim by devising a strategy for microvascular property mapping informed bythe synthetic signals, and focussing on the quantification of blood velocity distribution moments and of anapparent network branching* index. These were estimated in silico and in vivo, in healthy volunteers scanned at1.5T and 3T and in 13 cancer patients, scanned at 1.5T. In conclusion, realistic flow simulations, as thoseenabled by SpinFlowSim, may play a key role in the development of the next-generation of dMRI methods formicrovascular mapping, with immediate applications in oncology.
扩散磁共振成像(dMRI)可使MRI信号对自旋运动敏感,这其中既包括布朗扩散,也涵盖了通过复杂毛细血管网络的血流运动。这种效应即体素内不相干运动(IVIM),它使得利用dMRI表征微血管成为可能,具体可通过血管信号分数𝑓𝑉或血管表观扩散系数(ADC)𝐷∗等指标实现。尽管IVIM指标对灌注敏感,但其结果依赖于成像协议,并且其解读会因dMRI测量过程中自旋所处的血流状态(如扩散型 vs 弹道型)而变化——而对于给定体素,这种状态通常是未知的。这些因素阻碍了其在临床实践中的应用,因此需要创新的血管dMRI模型来实现体内毛细血管血流生物学标志物的计算。这类模型可能在癌症领域具有重要应用,例如评估针对肿瘤血管的抗血管生成疗法的响应情况。 本文针对这一需求,引入了SpinFlowSim——一种针对管道网络内血流的开源dMRI信号模拟器。SpinFlowSim专为毛细血管内的层流模式设计,在给定从组织学重建的网络结构时,能够合成高度逼真的微血管dMRI信号。我们通过为15个从肝活检中重建的、包含癌组织和非癌组织的网络生成合成信号来展示该模拟器的能力。这些信号表现出复杂的非单指数行为,与体内信号模式一致,表明同一网络内存在不同血流状态,且与扩散时间相关。 此外,我们还通过设计一种基于合成信号的微血管特性映射策略,重点量化血流速度分布矩和表观网络分支指数,展示了SpinFlowSim的潜在应用价值。这些指标在健康志愿者(1.5T和3T扫描)和13例癌症患者(1.5T扫描)中通过计算机模拟和体内实验进行了估计。 综上所述,SpinFlowSim所实现的真实血流模拟可能在下一代dMRI微血管映射方法的开发中发挥关键作用,并可立即应用于肿瘤学领域。
Method
方法
In this section we illustrate the computational engine upon whichSpinFlowSim relies, illustrated in Fig. 1. Afterwards, we present thehistological data used to generate realistic vascular networks, and thendescribe how synthetic dMRI signals were used to inform microvasculature parameter estimation in silico and in vivo.
在本节中,我们将阐释SpinFlowSim所依赖的计算引擎(如图1所示)。随后,我们将介绍用于生成真实血管网络的组织学数据,并描述如何利用合成的dMRI信号在计算机模拟和体内实验中指导微血管参数估计。
Conclusion
结论
SpinFlowSim, our open-source, freely-available python simulator ofblood micro-perfusion in capillaries, enables the synthesis and characterisation of realistic microvascular dMRI signals. Perfusion simulationsin vascular networks reconstructed from histology may inform the noninvasive, numerical estimation of innovative microvascular propertiesthrough dMRI, whose feasibility is demonstrated herein in vivo inhealthy subjects and in cancer patients.
SpinFlowSim是我们开发的开源Python模拟器,可免费获取,用于模拟毛细血管中的血液微灌注,能够合成和表征真实的微血管dMRI信号。从组织学重建的血管网络中进行灌注模拟,可通过dMRI为无创、数字化估计新型微血管特性提供依据,其可行性已在健康受试者和癌症患者的体内实验中得到验证。
Results
结果
3.1. Vascular networks
Fig. 2 illustrates the 15 vascular networks generated in this studyfrom liver tumour biopsies. Out of the total, 3 were segmented onnon-cancerous liver parenchyma, while the remaining 12 on canceroustissue. The 3 non-cancerous networks were drawn on liver tissue foundon the histological slide, adjacent to tumour tissue (n = 2 melanomametastases; n = 1 ovarian cancer metastasis). The 12 networks drawnon cancerous tissue came from primary liver hepatocellular carcinoma(HCC, n = 5), or from liver metastases of colorectal cancer (CRC, n = 5),endometrial cancer (n = 1), and melanoma (n = 1).Table 1 reports salient statistics of the vascular networks shown inFig. 2, related to capillary radii, length, velocity distribution, number ofvascular segments sensed by flowing spins and number of input/outputpaths. None of the networks contain close loops, and all capillarysegments are always part of at least one flow path connecting the inletto the outlet. The network size varies from approximately 240 to up to600 μm. The number of segments varies from 42 to 77, while the meaninput/output path length from approximately 316 to 753 μm. The tableshows that different network morphologies lead to different blood velocity distributions. For example, mean 𝑣𝑚 across VFR realisations canvary from as low as approximately 4 mm/s up to 25 mm/s. This rangeof variation is mirrored in the average number of capillaries bloodtravels through during the simulation (𝐴𝑁𝐵 metric), which varies fromjust over 12 up to almost 57 segments (note that in some cases, 𝐴𝑁𝐵can be slightly higher than the total number of segments, given thatspins reaching the outlet of the network continue flowing in a copy ofthe network itself). The mean path length 𝑃 𝐿𝑚 also varies considerably,e.g., from just over 300 μm for network 3, exhibiting the fastest flowamong networks, to up to roughly 700 μm, as in networks 5 or 6.
图2展示了本研究从肝肿瘤活检中生成的15个血管网络。其中3个分割自非癌性肝实质,其余12个来自癌组织。3个非癌性网络取自组织学切片上邻近肿瘤组织的肝组织(2例黑色素瘤转移灶,1例卵巢癌转移灶)。12个癌组织来源的网络中,5例为原发性肝细胞癌(HCC),5例为结直肠癌(CRC)肝转移灶,1例子宫内膜癌和1例黑色素瘤肝转移灶。 表1报告了图2中血管网络的关键统计数据,包括毛细血管半径、长度、速度分布、血流自旋感知的血管节段数量及输入/输出路径数量。所有网络均无闭合环路,且所有毛细血管节段至少属于一条连接入口与出口的血流路径。网络尺寸约为240-600 μm,节段数量为42-77个,平均输入/输出路径长度约316-753 μm。 表中显示,不同网络形态导致血流速度分布差异显著。例如,不同体积流量率(VFR)下的平均血流速度𝑣**𝑚范围为4-25 mm/s,这一变化范围与模拟中血液流经的平均毛细血管数量(𝐴𝑁𝐵指标)一致,其值为12-57个节段(需注意,由于自旋到达网络出口后会继续在复制网络中流动,部分情况下𝐴𝑁𝐵可能略高于总节段数)。平均路径长度𝑃𝐿**𝑚也存在较大差异,如流速最快的网络3约为300 μm,而网络5和6可达700 μm。
Figure
图
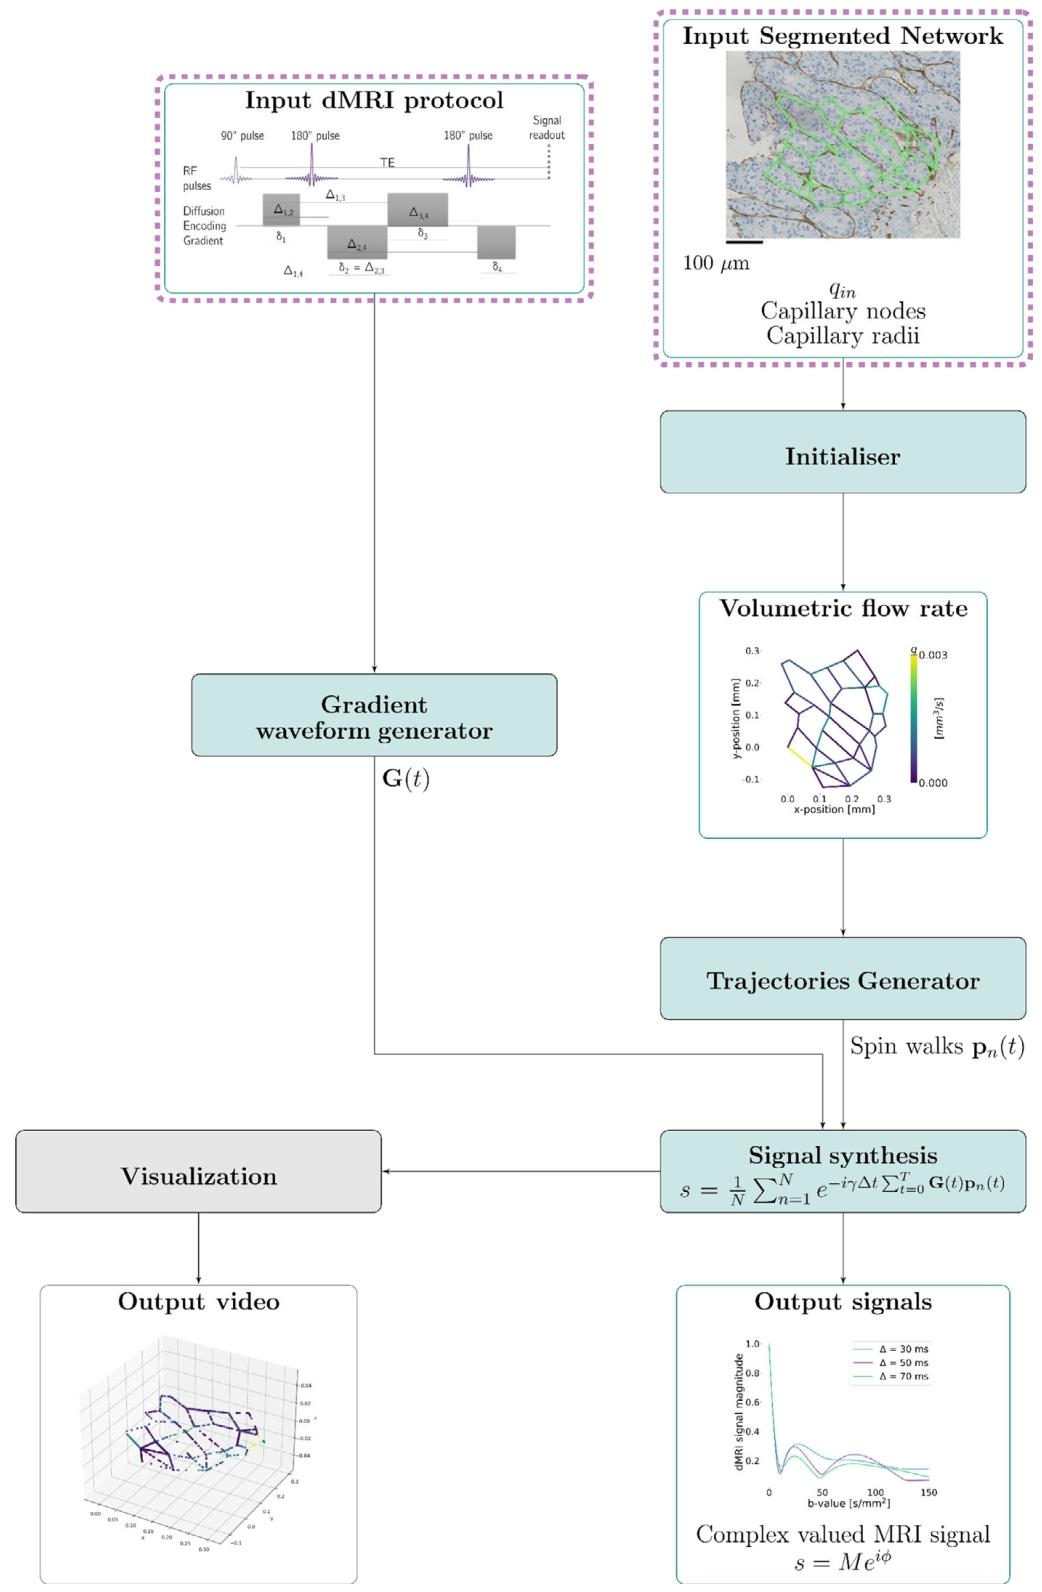
Fig. 1. Outline of the proposed SpinFlowSim framework. The dashed boxes indicate user-provided input information. An illustrative example of a network segmented on a biopsywith resolved volumetric flow rates for an input flow 𝑞𝑖𝑛 = 3.1 ⋅ 10−3 mm3/s and synthesised signals are shown.
图1. 所提出的SpinFlowSim框架概述。虚线框表示用户提供的输入信息。图中展示了一个在活检样本上分割的网络示例,其输入流量𝑞𝑖𝑛 = 3.1⋅10⁻³ mm³/s时的解析体积流量率,以及合成的信号。

Fig. 2. Vascular networks segmented on digitised liver tumour biopsies (resolution: 0.454 μm). Each network is labelled as ‘‘Non-Cancerous’’ or ‘‘Cancerous’’, depending on whetherit was drawn on non-cancerous liver parenchyma or on tumour tissue. For the latter case, the primary cancer is also indicated (CRC stands for Colorectal Cancer, while HCCfor Hepatocellular Carcinoma). The non-cancerous networks were drawn on liver tissue found on liver tumour biopsies of patients suffering from Melanoma (n = 2) and Ovariancancer (n = 1)
图2. 从数字化肝肿瘤活检样本中分割的血管网络(分辨率:0.454 μm)。每个网络根据其绘制于非癌性肝实质还是肿瘤组织,标记为“非癌性”或“癌性”。对于癌性情况,还会注明原发癌类型(CRC代表结直肠癌,HCC代表肝细胞癌)。非癌性网络取自黑色素瘤患者(n=2)和卵巢癌患者(n=1)肝肿瘤活检样本中的肝组织。
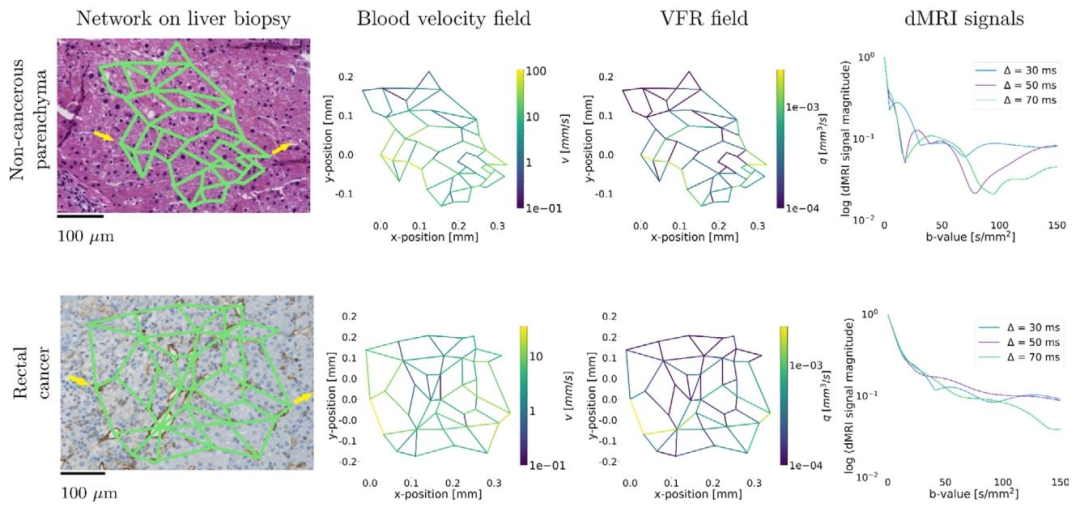
Fig. 3. Examples of resolved vascular networks. The top row shows results from a vascular network segmented on a HE-stained non-cancerous liver region, found on a biopsy ofa patient with metastatic melanoma (Net 6). The bottom panel shows results from a CD31-stained rectal cancer area (Net 12). From left to right, we show the vascular network,the resolved blood flow velocity field for 𝑞𝑖𝑛 = 3.1 ⋅ 10−3 mm3/s, and examples of dMRI signal decay over a range of b-values (0–150 s∕mm2 ) and diffusion times (𝛥 = {30, 50,70} ms, 𝛿 = 20 ms). The inlet/outlet were: nodes 0 and 33 for Net 6; nodes 0 and 14 for Net 12. These have been indicated by input/output yellow arrows.
图3. 解析血管网络示例。顶行显示了从转移性黑色素瘤患者活检样本中HE染色的非癌性肝区域分割的血管网络结果(网络6)。底行显示了CD31染色的直肠癌区域结果(网络12)。从左到右依次为:血管网络、输入流量𝑞**𝑖𝑛 = 3.1⋅10⁻³ mm³/s时的解析血流速度场,以及在b值范围(0–150 s/mm²)和扩散时间(𝛥 = {30, 50, 70} ms,𝛿 = 20 ms)下的dMRI信号衰减示例。网络6的入口/出口为节点0和33;网络12为节点0和14,已通过输入/输出黄色箭头标注。

Fig. 4. Scatter plots relating estimated and ground truth microvascular parameters in computer simulations. First row (panels (a), (b), (c)): results for protocol ‘‘PGSE in vivo’’.Second row (panels (d), (e), (f)): results for protocol ‘‘TRSE’’. Third row (panels (g), (h), (i)): results for protocol ‘‘richPGSE subset’’. Fourth row (panels (j), (k), (l)): results forprotocol ‘‘richPGSE’’. From left to right: results for metric 𝑣𝑚 (panels (a), (d), (g), (j)); results for metric 𝑣𝑠 (panels (b), (e), (h), (k)); results for metric 𝐴𝑁𝐵 (panels (c), (f), (i),(l)).Spearman’s and Pearson’s correlation coefficients between estimated and ground truth values are also reported in each plot
图4. 计算机模拟中估计微血管参数与真实值的散点图。第一行(图(a)、(b)、(c)):“体内PGSE”协议结果;第二行(图(d)、(e)、(f)):“TRSE”协议结果;第三行(图(g)、(h)、(i)):“richPGSE子集”协议结果;第四行(图(j)、(k)、(l)):“richPGSE”协议结果。从左至右分别为:𝑣𝑚指标(图(a)、(d)、(g)、(j))、𝑣**𝑠指标(图(b)、(e)、(h)、(k))、𝐴𝑁𝐵指标(图(c)、(f)、(i)、(l))。各图中还报告了估计值与真实值的斯皮尔曼和皮尔逊相关系数。

Fig. 5. Representative vascular voxel signals measured in two healthy volunteers in vivo. Top (A–D): signals from healthy volunteer 4, scanned on a 3T system, with the ‘‘PGSEinvivo’’protocol, based on routine PGSE. Bottom (E–H): signals from healthy volunteer 2, scanned on a 1.5T system, with the ‘‘TRSEinvivo’’ protocol, based on a DW TRSE acquisition.From left to right, signals from different ROIs are shown: kidney cortex (A and E); kidney medulla (B and F); spleen (C and G); liver parenchyma (D and H). The figure reportsthe median and the inter-quartile range of variation of the signal across voxels within the ROI. An estimated range of noise floor fluctuations is also reported in grey
图5. 两名健康志愿者体内测得的代表性血管体素信号。顶部(A-D):健康志愿者4在3T系统上采用基于常规PGSE的“体内PGSE”协议扫描的信号。底部(E-H):健康志愿者2在1.5T系统上采用基于DW TRSE采集的“体内TRSE”协议扫描的信号。从左到右显示不同ROI的信号:肾皮质(A和E);肾髓质(B和F);脾脏(C和G);肝实质(D和H)。图中报告了ROI内体素信号的中位数和四分位距变化范围,灰色区域还报告了噪声本底波动的估计范围。

Fig. 6. Microvascular maps in a representative healthy volunteer scanned on the 1.5T system with protocol ‘‘TRSEinvivo’’. (a): labelled scan; (b) and (c): IVIM maps 𝑓**𝑉 and 𝐷 ;(d), (e) and (f): microvascular indices 𝑣𝑚 , 𝑣𝑠 and 𝐴𝑁𝐵. In the labelled scan, we highlight the location of the liver and the spleen
图6. 一名代表性健康志愿者在1.5T系统上采用“体内TRSE”协议扫描的微血管图。(a):标记扫描图;(b)和(c):IVIM参数图𝑓𝑉和𝐷∗;(d)、(e)和(f):微血管指数𝑣𝑚、𝑣𝑠和𝐴𝑁𝐵。在标记扫描图中,我们标出了肝脏和脾脏的位置。

Fig. 7. Microvascular maps in the healthy volunteer scanned on the 3T system with protocol ‘‘PGSEinvivo’’. (a): labelled scan; (b) and (c): IVIM maps 𝑓𝑉 and 𝐷∗ ; (d), (e) and(f): microvascular indices 𝑣𝑚 , 𝑣𝑠 and 𝐴𝑁𝐵. In the labelled scan, we highlight the location of the liver, the spleen and of the kidneys.
图7. 健康志愿者在3T系统上采用“体内PGSE”协议扫描的微血管图。(a):标记扫描图;(b)和(c):IVIM参数图𝑓𝑉和𝐷∗;(d)、(e)和(f):微血管指数𝑣𝑚、𝑣𝑠和𝐴𝑁𝐵。在标记扫描图中,我们标出了肝脏、脾脏和肾脏的位置。

Fig. 8. Bar plots reporting mean and standard error of the mean of all microvascular metrics in the different regions-of-interest (ROIs) of the four healthy volunteers. (a): trendsfor metric 𝑓𝑉 ; (b): trends for metric 𝐷∗ ; (c): trends for metric 𝑣𝑚 ; (d): trends for metric 𝑣𝑠 ; (e): trends for metric 𝐴𝑁𝐵.
图8. 柱状图展示了四名健康志愿者不同感兴趣区域(ROI)中所有微血管指标的均值和均值标准误差。(a):血管信号分数𝑓𝑉的趋势;(b):血管表观扩散系数𝐷∗的趋势;(c):血流速度均值𝑣𝑚的趋势;(d):血流速度标准差𝑣𝑠的趋势;(e):表观网络分支指数𝐴𝑁𝐵的趋势。
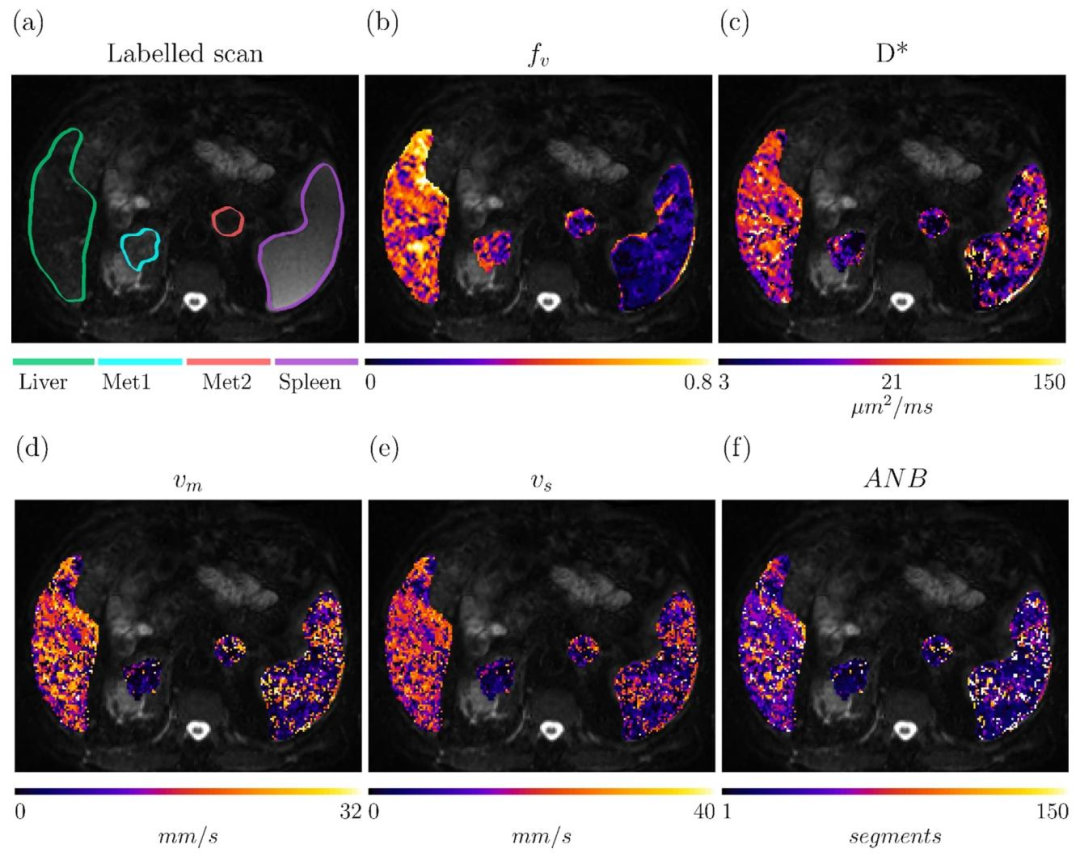
Fig. 9. Parametric maps obtained in adrenal metastases, liver and spleen of a 61 y.o. male patient, suffering from advanced rectal cancer (patient 8, scanned on a 1.5T SiemensAvanto system with a DW TRSE sequence). Top row: labelled scan and IVIM maps 𝑓𝑉 and 𝐷∗ . Bottom row: microvascular parameters obtained via simulation-informed modelfitting, namely: mean blood velocity 𝑣𝑚 , blood velocity standard deviation 𝑣𝑠 , and Apparent Network Branching 𝐴𝑁𝐵.
图9. 一名61岁晚期直肠癌男性患者(患者8,使用1.5T西门子Avanto系统通过DW TRSE序列扫描)肾上腺转移灶、肝脏和脾脏的参数图。顶行:标记扫描图及IVIM参数图𝑓𝑉(血管信号分数)和𝐷∗(血管表观扩散系数)。底行:通过模拟指导模型拟合获得的微血管参数,即血流速度均值𝑣𝑚、血流速度标准差𝑣𝑠和表观网络分支指数𝐴𝑁𝐵。
Table
表

Table 1Summary of vascular networks with corresponding microvascular properties generated for this study. The non-cancerous networks were drawn on non-cancerous liver tissue foundon biopsies from melanoma (n = 2) and ovarian cancer (n = 1) metastases. Mean patient age was 66.2 years. Male = 5, Female = 6. CRC = colorectal cancer, HCC = hepatocellularcarcinoma, EC = Endometrial cancer. Vascular network metrics are: mean and standard deviation of blood velocity, 𝑣𝑚 and 𝑣𝑠 ; mean and standard deviation of the VFR, 𝑞𝑚 and𝑞𝑠* ; apparent network branching 𝐴𝑁𝐵; mean radius 𝑟𝑚 ; mean segment length 𝑆𝐿**𝑚 ; mean path length 𝑃 𝐿𝑚 ; the number of input/output (I/O) paths and the network dimensions.The dimensions have been indicated by two metrics, namely the actual Network Size (maximum euclidean distance between any pair of nodes), and the total number of segments.For ech metric (beyond those describing the network dimensions), the mean and the standard deviation (in bracket) over the 100 realisations of each network (10 input/outputnode combinations × 10 input VFRs) are reported.
表1 本研究生成的血管网络及其相应微血管特性汇总 非癌性网络取自黑色素瘤(n=2)和卵巢癌(n=1)转移灶活检样本中的非癌性肝组织。患者平均年龄66.2岁,男性5例,女性6例。CRC=结直肠癌,HCC=肝细胞癌,EC=子宫内膜癌。血管网络指标包括:血流速度均值及标准差(𝑣𝑚、𝑣𝑠);体积流量率均值及标准差(𝑞𝑚、𝑞𝑠);表观网络分支指数(𝐴𝑁𝐵);平均半径(𝑟𝑚);平均节段长度(𝑆𝐿𝑚);平均路径长度(𝑃𝐿𝑚);输入/输出(I/O)路径数量及网络维度。网络维度通过两项指标表示:实际网络尺寸(任意节点对之间的最大欧氏距离)和总节段数。对于每个指标(除描述网络维度的指标外),报告每个网络100次实现(10个输入/输出节点组合×10个输入VFR)的均值和标准差(括号内)。

Table 2Summary of healthy volunteers’ demographics (age in years, sex) and trends of microvascular metrics 𝑓𝑉 , 𝐷∗ , 𝑣𝑚 , 𝑣𝑠 and 𝐴𝑁𝐵 within the manually-segmented ROIs (mean andstandard deviation). For sex, F indicated female, while M male. For the acquisition on the 1.5T system, routine IVIM metrics 𝑓𝑉 and 𝐷∗ were obtained at fixed diffusion time, onthe dMRI scan with the shortest TE
表2 健康志愿者人口统计学特征(年龄、性别)及手动分割感兴趣区(ROI)内微血管指标 𝑓𝑉、𝐷∗、𝑣𝑚、𝑣𝑠 和 𝐴𝑁𝐵 的趋势总结(均值和标准差)。性别中,F 表示女性,M 表示男性。对于1.5T系统采集的数据,常规IVIM指标 𝑓𝑉 和 𝐷∗ 是在固定扩散时间下,从最短TE的dMRI扫描中获取的。

Table 3Summary of patients’ demographics and key clinical data (primary cancer type, location of the imaged tumours, patients’ sex and age, in years) and trends of microvascular metrics𝑓𝑉* , 𝐷∗ , *𝑣𝑚* , 𝑣**𝑠 and 𝐴𝑁𝐵 within the manually-segmented tumours (mean and standard deviation). For sex, F indicated female, while M male. Routine IVIM metrics 𝑓𝑉 and 𝐷∗were obtained at fixed diffusion time, on the dMRI scan with the shortest TE
表3 患者人口统计学及关键临床数据(原发癌类型、成像肿瘤位置、患者性别和年龄)汇总,以及手动分割肿瘤内微血管指标𝑓𝑉、𝐷∗、𝑣𝑚、𝑣𝑠和𝐴𝑁𝐵的趋势(均值和标准差)。性别中F代表女性,M代表男性。常规IVIM指标𝑓𝑉和𝐷∗是在固定扩散时间、最短TE的dMRI扫描中获得的。


)


-IDEA集成调试配置)


)


JDK JVM)